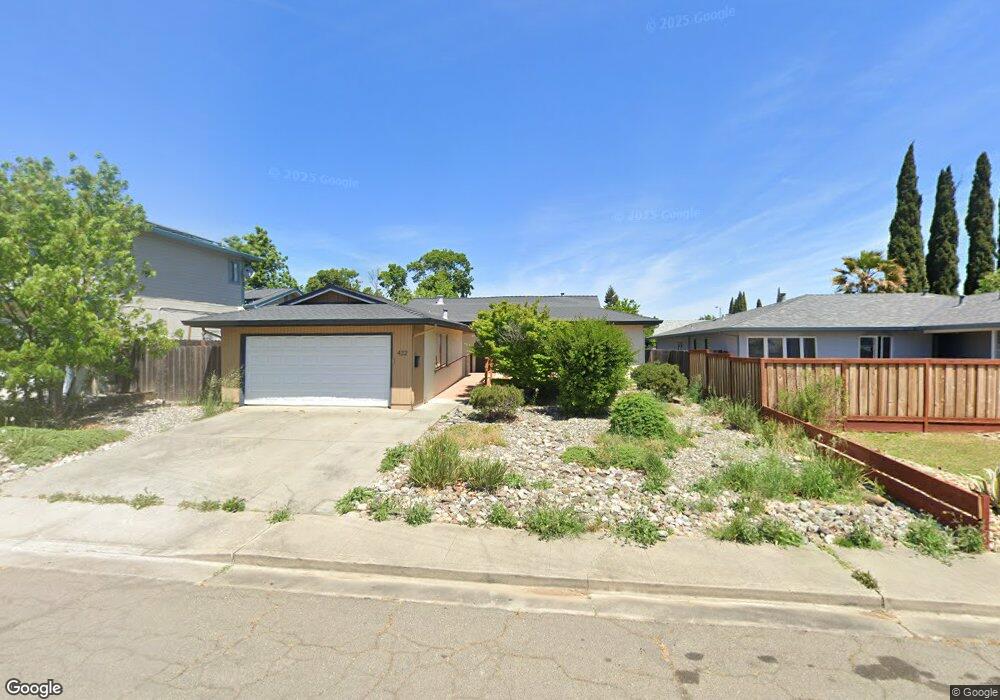
422 Lily St Fairfield, CA 94533
Estimated Value: $420,000 - $508,000
3
Beds
2
Baths
1,337
Sq Ft
$346/Sq Ft
Est. Value
About This Home
This home is located at 422 Lily St, Fairfield, CA 94533 and is currently estimated at $462,185, approximately $345 per square foot. 422 Lily St is a home located in Solano County with nearby schools including Dover Elementary School, Grange Middle School, and Fairfield High School.
Ownership History
Date
Name
Owned For
Owner Type
Purchase Details
Closed on
Jun 10, 2013
Sold by
Liang Yanzhong
Bought by
Liang Yanzhong and Yang Shu Da Ou
Current Estimated Value
Purchase Details
Closed on
Jun 21, 2012
Sold by
Taylor Allene Marie
Bought by
Liang Yanzhong
Home Financials for this Owner
Home Financials are based on the most recent Mortgage that was taken out on this home.
Original Mortgage
$132,000
Outstanding Balance
$91,223
Interest Rate
3.77%
Mortgage Type
New Conventional
Estimated Equity
$370,962
Purchase Details
Closed on
Jun 20, 2012
Sold by
Yang Shu Da Ou
Bought by
Liang Yanzhong
Home Financials for this Owner
Home Financials are based on the most recent Mortgage that was taken out on this home.
Original Mortgage
$132,000
Outstanding Balance
$91,223
Interest Rate
3.77%
Mortgage Type
New Conventional
Estimated Equity
$370,962
Purchase Details
Closed on
May 16, 2008
Sold by
Hidalgo Elisa J
Bought by
Hidalgo Elisa J
Create a Home Valuation Report for This Property
The Home Valuation Report is an in-depth analysis detailing your home's value as well as a comparison with similar homes in the area
Home Values in the Area
Average Home Value in this Area
Purchase History
We collect this data history from publicly available records. To have your information removed, we recommend requesting removal directly through your county’s website.
| Date | Buyer | Sale Price | Title Company |
|---|---|---|---|
| Liang Yanzhong | -- | None Available | |
| Liang Yanzhong | $165,000 | Fidelity National Title Co | |
| Liang Yanzhong | -- | Fidelity National Title Co | |
| Hidalgo Elisa J | -- | None Available |
Source: Public Records
Mortgage History
We collect this data history from publicly available records. To have your information removed, we recommend requesting removal directly through your county’s website.
| Date | Status | Borrower | Loan Amount |
|---|---|---|---|
| Open | Liang Yanzhong | $132,000 |
Source: Public Records
Tax History
| Year | Tax Paid | Tax Assessment Tax Assessment Total Assessment is a certain percentage of the fair market value that is determined by local assessors to be the total taxable value of land and additions on the property. | Land | Improvement |
|---|---|---|---|---|
| 2025 | $2,333 | $207,239 | $56,517 | $150,722 |
| 2024 | $2,333 | $203,176 | $55,409 | $147,767 |
| 2023 | $2,262 | $199,193 | $54,323 | $144,870 |
| 2022 | $2,235 | $195,288 | $53,259 | $142,029 |
| 2021 | $2,213 | $191,460 | $52,215 | $139,245 |
| 2020 | $2,161 | $189,498 | $51,680 | $137,818 |
| 2019 | $2,109 | $185,783 | $50,667 | $135,116 |
| 2018 | $2,176 | $182,141 | $49,674 | $132,467 |
| 2017 | $2,076 | $178,570 | $48,700 | $129,870 |
| 2016 | $2,055 | $175,070 | $47,746 | $127,324 |
| 2015 | $1,919 | $172,441 | $47,029 | $125,412 |
| 2014 | $1,902 | $169,064 | $46,108 | $122,956 |
Source: Public Records
Map
Nearby Homes
- 2495 Carnation Dr
- 2698 Laurel Dr
- 15 Dali Ct
- 2680 Marigold Dr
- 292 Begonia Blvd
- 41 Goya Dr
- 278 Jasmine St
- 102 Goya Dr
- 45 Goya Dr
- 2326 Cunningham Dr
- 114 Goya Dr
- 209 Begonia Blvd
- 2275 Cambridge Dr
- 2256 Dorset Ln
- 333 Honeysuckle Dr
- 2731 Orchid St
- 2214 Pennsylvania Ave
- 2869 Marigold Dr
- 937 Pacific Ave
- 1301 Sunningdale Ln
Your Personal Tour Guide
Ask me questions while you tour the home.