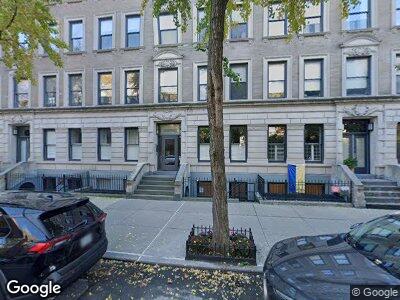
422 W 20th St Unit 3H New York, NY 10011
Chelsea NeighborhoodEstimated Value: $1,430,120 - $1,835,000
--
Bed
--
Bath
906
Sq Ft
$1,785/Sq Ft
Est. Value
About This Home
This home is located at 422 W 20th St Unit 3H, New York, NY 10011 and is currently estimated at $1,617,530, approximately $1,785 per square foot. 422 W 20th St Unit 3H is a home located in New York County with nearby schools including P.S. 11 Sarah J. Garnet School, Clinton School, and Middle School 297.
Ownership History
Date
Name
Owned For
Owner Type
Purchase Details
Closed on
Nov 12, 2015
Sold by
Annecca Leonardo and Staerk Ann Sophie
Bought by
Lilliana Helen Neuwald Trustee and The Caletia Trust
Current Estimated Value
Home Financials for this Owner
Home Financials are based on the most recent Mortgage that was taken out on this home.
Original Mortgage
$1,215,500
Outstanding Balance
$976,750
Interest Rate
3.87%
Mortgage Type
Purchase Money Mortgage
Estimated Equity
$522,162
Purchase Details
Closed on
Dec 20, 2012
Sold by
420 West 20Th Street Llc and % The Brodsky Organization
Bought by
Annecca Leonardo and Staerk Ann Sophie
Home Financials for this Owner
Home Financials are based on the most recent Mortgage that was taken out on this home.
Original Mortgage
$784,000
Interest Rate
3.35%
Mortgage Type
Purchase Money Mortgage
Create a Home Valuation Report for This Property
The Home Valuation Report is an in-depth analysis detailing your home's value as well as a comparison with similar homes in the area
Home Values in the Area
Average Home Value in this Area
Purchase History
| Date | Buyer | Sale Price | Title Company |
|---|---|---|---|
| Lilliana Helen Neuwald Trustee | $1,870,000 | -- | |
| Annecca Leonardo | $1,140,440 | -- | |
| Annecca Leonardo | $1,140,440 | -- |
Source: Public Records
Mortgage History
| Date | Status | Borrower | Loan Amount |
|---|---|---|---|
| Open | Lilliana Helen Neuwald Trustee | $1,215,500 | |
| Previous Owner | Annecca Leonardo | $85,000 | |
| Previous Owner | Annecca Leonardo | $784,000 |
Source: Public Records
Tax History Compared to Growth
Tax History
| Year | Tax Paid | Tax Assessment Tax Assessment Total Assessment is a certain percentage of the fair market value that is determined by local assessors to be the total taxable value of land and additions on the property. | Land | Improvement |
|---|---|---|---|---|
| 2024 | $18,850 | $150,778 | $27,527 | $123,251 |
| 2023 | $17,986 | $146,620 | $27,527 | $119,093 |
| 2022 | $16,533 | $135,131 | $27,527 | $107,604 |
| 2021 | $16,577 | $135,136 | $27,527 | $107,609 |
| 2020 | $13,663 | $152,792 | $27,527 | $125,265 |
| 2019 | $12,671 | $148,855 | $27,527 | $121,328 |
| 2018 | $14,209 | $143,659 | $27,527 | $116,132 |
| 2017 | $12,816 | $122,296 | $27,527 | $94,769 |
| 2016 | $11,433 | $96,283 | $27,527 | $68,756 |
| 2015 | -- | $97,825 | $27,527 | $70,298 |
| 2014 | -- | $98,494 | $27,527 | $70,967 |
Source: Public Records
Map
Nearby Homes
- 422 W 20th St Unit 5A
- 422 W 20th St
- 422 W 20th St Unit PARLOR H
- 422 W 20th St Unit 3G
- 435 W 19th St Unit 2 C
- 435 W 19th St Unit 1A
- 435 W 19th St Unit 3 A
- 435 W 19th St Unit 3 C
- 435 W 19th St Unit 3 D
- 435 W 19th St Unit 4A
- 436 W 20th St Unit TH
- 443 W 19th St
- 445 W 19th St Unit 3G
- 428 W 19th St Unit 2C
- 428 W 19th St Unit THA
- 428 W 19th St Unit PH
- 428 W 19th St Unit 3A
- 428 W 19th St Unit 8C
- 428 W 19th St Unit 8D
- 428 W 19th St Unit 3B
- 422 W 20th St Unit 5G
- 422 W 20th St Unit 2F
- 422 W 20th St Unit 5E
- 422 W 20th St Unit 3A
- 422 W 20th St Unit 5H
- 422 W 20th St Unit 2A
- 422 W 20th St Unit 3F
- 422 W 20th St Unit 3H
- 422 W 20th St Unit 2H
- 422 W 20th St Unit 5EF
- 422 W 20th St Unit 3C
- 422 W 20th St Unit 2D
- 422 W 20th St Unit 2E
- 422 W 20th St Unit 5D
- 422 W 20th St Unit 5C
- 422 W 20th St Unit PARLOR D
- 422 W 20th St Unit PARLOR A
- 422 W 20th St Unit D
- 422 W 20th St Unit 4
- 422 W 20th St Unit 4-H