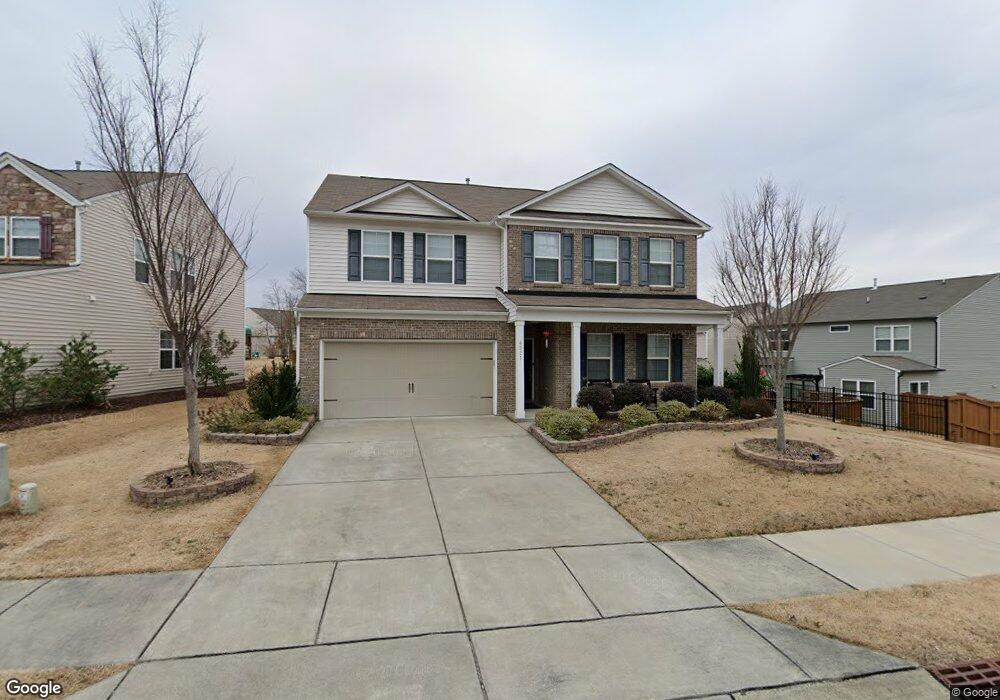
4221 Auburn Hills Dr Raleigh, NC 27609
Forestville NeighborhoodEstimated Value: $471,000 - $502,000
4
Beds
3
Baths
3,129
Sq Ft
$156/Sq Ft
Est. Value
About This Home
This home is located at 4221 Auburn Hills Dr, Raleigh, NC 27609 and is currently estimated at $487,402, approximately $155 per square foot. 4221 Auburn Hills Dr is a home located in Wake County with nearby schools including Harris Creek Elementary School, Rolesville Middle School, and Rolesville High School.
Ownership History
Date
Name
Owned For
Owner Type
Purchase Details
Closed on
Jan 10, 2025
Sold by
Vanvanngo Son Van and Le Hanh
Bought by
Ngo Phuoc Vinh and Ngo Tu Thi
Current Estimated Value
Purchase Details
Closed on
May 8, 2018
Sold by
Ngo Loan and Tran Hoa
Bought by
Ngo Phuoc Vinh and Cam Ngo Tu Thi
Purchase Details
Closed on
Jun 27, 2016
Sold by
Ice Jason S and Millman Brooke
Bought by
Ngo Loan and Tran Hoa
Home Financials for this Owner
Home Financials are based on the most recent Mortgage that was taken out on this home.
Original Mortgage
$234,400
Interest Rate
3.54%
Mortgage Type
New Conventional
Purchase Details
Closed on
Sep 29, 2011
Sold by
Centex Homes
Bought by
Ice Jason S and Millman Brooke
Home Financials for this Owner
Home Financials are based on the most recent Mortgage that was taken out on this home.
Original Mortgage
$232,725
Interest Rate
4.24%
Mortgage Type
New Conventional
Create a Home Valuation Report for This Property
The Home Valuation Report is an in-depth analysis detailing your home's value as well as a comparison with similar homes in the area
Home Values in the Area
Average Home Value in this Area
Purchase History
| Date | Buyer | Sale Price | Title Company |
|---|---|---|---|
| Ngo Phuoc Vinh | -- | None Listed On Document | |
| Ngo Phuoc Vinh | -- | None Available | |
| Ngo Loan | $293,000 | None Available | |
| Ice Jason S | $245,000 | None Available |
Source: Public Records
Mortgage History
| Date | Status | Borrower | Loan Amount |
|---|---|---|---|
| Previous Owner | Ngo Loan | $234,400 | |
| Previous Owner | Ice Jason S | $232,725 |
Source: Public Records
Tax History Compared to Growth
Tax History
| Year | Tax Paid | Tax Assessment Tax Assessment Total Assessment is a certain percentage of the fair market value that is determined by local assessors to be the total taxable value of land and additions on the property. | Land | Improvement |
|---|---|---|---|---|
| 2025 | $4,111 | $469,074 | $80,000 | $389,074 |
| 2024 | $4,094 | $469,074 | $80,000 | $389,074 |
| 2023 | $3,494 | $318,673 | $40,000 | $278,673 |
| 2022 | $3,247 | $318,673 | $40,000 | $278,673 |
| 2021 | $3,121 | $318,673 | $40,000 | $278,673 |
| 2020 | $3,064 | $318,673 | $40,000 | $278,673 |
| 2019 | $3,029 | $259,609 | $40,000 | $219,609 |
| 2018 | $2,856 | $259,609 | $40,000 | $219,609 |
| 2017 | $2,721 | $259,609 | $40,000 | $219,609 |
| 2016 | -- | $259,609 | $40,000 | $219,609 |
| 2015 | $2,751 | $263,727 | $50,000 | $213,727 |
| 2014 | $2,609 | $263,727 | $50,000 | $213,727 |
Source: Public Records
Map
Nearby Homes
- 8111 Yaxley Hall Dr
- Plan 1501 Modeled at Tucker Place
- Plan 1808 at Tucker Place
- Plan 2764 Modeled at Tucker Place
- Plan 1638 at Tucker Place
- Plan 1342 at Tucker Place
- Plan 2328 at Tucker Place
- Plan 1558 at Tucker Place
- Plan 2277 Modeled at Tucker Place
- 8341 Hollister Hills Dr
- 2660 Princess Tree Dr
- 2628 Pivot Ridge Dr
- 4007 Newell Ln
- 2410 Abbot Hall Dr
- 8005 Caithness St
- 8504 Lasilla Way
- 2685 Princess Tree Dr
- 2625 Nordmann Fir Rd
- 2821 Casona Way
- 8602 Holdenby Trail
- 4215 Auburn Hills Dr Unit 503
- 4229 Auburn Hills Dr
- 3537 Sun Catcher Ln
- 8052 Remington Heights Dr
- 4209 Auburn Hills Dr
- 8056 Remington Heights Dr
- 4228 Auburn Hills Dr
- 417 Auburn Hills Dr Unit 417
- 408 Auburn Hills Dr Unit 408
- 409 Auburn Hills Dr Unit 409
- 421 Auburn Hills Dr Unit 421
- 420 Auburn Hills Dr Unit 420
- 8048 Remington Heights Dr Unit Lot# 231
- 4205 Auburn Hills Dr
- 4224 Auburn Hills Dr Unit HCP Lot# 226
- 8041 Hartham Park Ave Unit 485
- 4220 Auburn Hills Dr
- 4216 Auburn Hills Dr
- 8044 Remington Heights Dr
- 8037 Hartham Park Ave