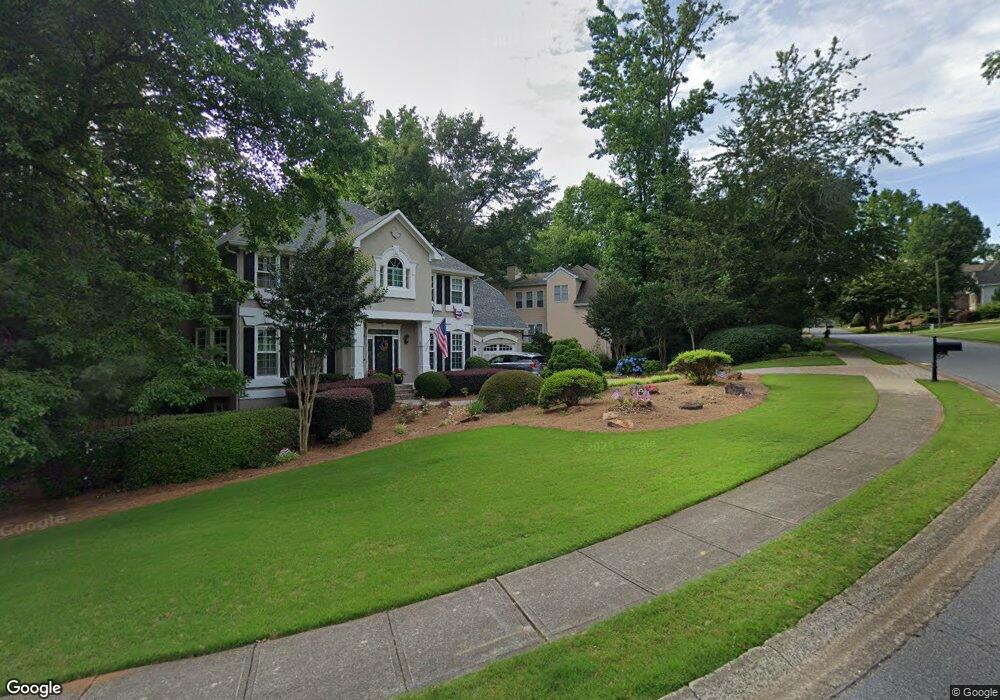
4221 Highborne Dr NE Unit 3 Marietta, GA 30066
Sandy Plains NeighborhoodEstimated Value: $731,000 - $824,000
4
Beds
5
Baths
2,883
Sq Ft
$273/Sq Ft
Est. Value
About This Home
This home is located at 4221 Highborne Dr NE Unit 3, Marietta, GA 30066 and is currently estimated at $787,570, approximately $273 per square foot. 4221 Highborne Dr NE Unit 3 is a home located in Cobb County with nearby schools including Davis Elementary School, Mabry Middle School, and Lassiter High School.
Ownership History
Date
Name
Owned For
Owner Type
Purchase Details
Closed on
Mar 12, 2003
Sold by
Vigilanti Barry F
Bought by
Vigilanti Barry F and Vigilanti Sheila
Current Estimated Value
Home Financials for this Owner
Home Financials are based on the most recent Mortgage that was taken out on this home.
Original Mortgage
$254,000
Interest Rate
5.86%
Mortgage Type
New Conventional
Purchase Details
Closed on
Mar 7, 2003
Sold by
Vigilanti Sheila T
Bought by
Vigilanti Barry F
Home Financials for this Owner
Home Financials are based on the most recent Mortgage that was taken out on this home.
Original Mortgage
$254,000
Interest Rate
5.86%
Mortgage Type
New Conventional
Purchase Details
Closed on
Oct 28, 1997
Sold by
Rogers Charles W and Rogers Vicki
Bought by
Vigilantin Barry F and Vigilantin Shelia F
Home Financials for this Owner
Home Financials are based on the most recent Mortgage that was taken out on this home.
Original Mortgage
$174,400
Interest Rate
7.31%
Mortgage Type
New Conventional
Create a Home Valuation Report for This Property
The Home Valuation Report is an in-depth analysis detailing your home's value as well as a comparison with similar homes in the area
Home Values in the Area
Average Home Value in this Area
Purchase History
| Date | Buyer | Sale Price | Title Company |
|---|---|---|---|
| Vigilanti Barry F | -- | -- | |
| Vigilanti Barry F | -- | -- | |
| Vigilantin Barry F | $218,000 | -- |
Source: Public Records
Mortgage History
| Date | Status | Borrower | Loan Amount |
|---|---|---|---|
| Previous Owner | Vigilanti Barry F | $254,000 | |
| Previous Owner | Vigilantin Barry F | $174,400 |
Source: Public Records
Tax History Compared to Growth
Tax History
| Year | Tax Paid | Tax Assessment Tax Assessment Total Assessment is a certain percentage of the fair market value that is determined by local assessors to be the total taxable value of land and additions on the property. | Land | Improvement |
|---|---|---|---|---|
| 2025 | $1,898 | $294,332 | $64,000 | $230,332 |
| 2024 | $1,843 | $274,084 | $64,000 | $210,084 |
| 2023 | $1,603 | $262,712 | $50,000 | $212,712 |
| 2022 | $1,734 | $237,636 | $44,000 | $193,636 |
| 2021 | $1,603 | $193,696 | $38,000 | $155,696 |
| 2020 | $1,603 | $193,696 | $38,000 | $155,696 |
| 2019 | $1,603 | $193,696 | $38,000 | $155,696 |
| 2018 | $1,549 | $175,680 | $36,000 | $139,680 |
| 2017 | $1,361 | $175,680 | $36,000 | $139,680 |
| 2016 | $1,275 | $147,064 | $23,200 | $123,864 |
| 2015 | $1,367 | $147,064 | $23,200 | $123,864 |
| 2014 | $3,989 | $147,064 | $0 | $0 |
Source: Public Records
Map
Nearby Homes
- 3333 Devaughn Dr NE
- 4302 Highborne Dr NE Unit 3
- 4219 N Mountain Rd NE
- 3350 Brookhill Cir
- 4397 Windsor Oaks Cir
- 4243 N Mountain Rd NE
- 3130 Maley Ct
- 3043 Sawyer Trace NE
- 4563 Ashmore Cir NE
- 3851 Timber Hollow Way
- 3480 Pebble Hill Dr
- 3238 Mountain Hollow Dr
- 2855 Lamer Trace
- 3147 Swallow Dr NE
- 4032 Ashmont Ct
- 4259 Arbor Club Dr
- 3798 Upland Dr
- 2713 Arbor Summit
- 4589 Wigley Estates Rd
- 4223 Highborne Dr NE Unit 3
- 0 Highborne Place
- 3271 Highborne Place NE Unit 3
- 4225 Highborne Dr NE
- 4224 Highborne Dr NE
- 3270 Highborne Place NE
- 3324 Devaughn Dr NE
- 3322 Devaughn Dr NE Unit 2
- 4226 Highborne Dr NE
- 4227 Highborne Dr NE
- 3273 Highborne Place NE
- 3320 Devaughn Dr NE
- 3326 Devaughn Dr NE
- 3272 Highborne Place NE
- 3443 Highborne Dr NE
- 3274 Highborne Place NE
- 3328 Devaughn Dr NE
- 0 Devaughn Dr Unit 7342266
- 0 Devaughn Dr Unit 7175890
- 0 Devaughn Dr Unit 8692487