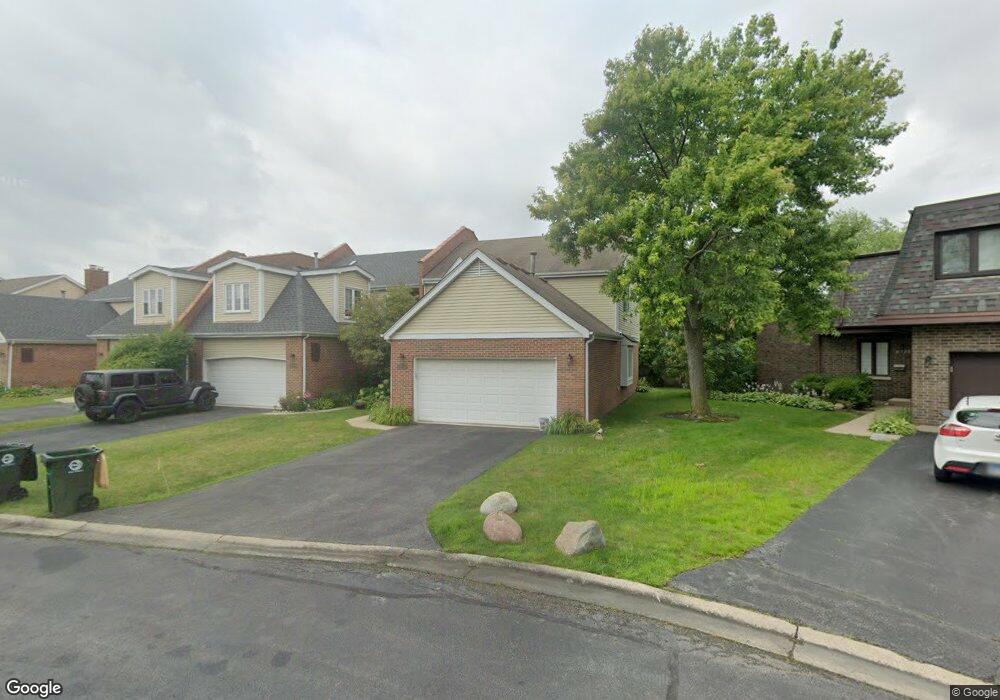
4222 Triumvera Dr Unit 11A Glenview, IL 60025
Estimated Value: $377,000 - $472,000
3
Beds
--
Bath
129,934
Sq Ft
$3/Sq Ft
Est. Value
About This Home
This home is located at 4222 Triumvera Dr Unit 11A, Glenview, IL 60025 and is currently estimated at $428,436, approximately $3 per square foot. 4222 Triumvera Dr Unit 11A is a home located in Cook County with nearby schools including Henking Elementary School, Hoffman Elementary School, and Springman Middle School.
Ownership History
Date
Name
Owned For
Owner Type
Purchase Details
Closed on
Jun 15, 2004
Sold by
Frolov Andrew
Bought by
Frolov Irina
Current Estimated Value
Purchase Details
Closed on
Feb 28, 1994
Sold by
Goldner Brian D and Goldner Barbara Kalt
Bought by
Gavrielov Yair and Gavrielov Shoshana
Create a Home Valuation Report for This Property
The Home Valuation Report is an in-depth analysis detailing your home's value as well as a comparison with similar homes in the area
Home Values in the Area
Average Home Value in this Area
Purchase History
| Date | Buyer | Sale Price | Title Company |
|---|---|---|---|
| Frolov Irina | -- | Republic Title Company Inc | |
| Gavrielov Yair | $138,000 | -- |
Source: Public Records
Tax History Compared to Growth
Tax History
| Year | Tax Paid | Tax Assessment Tax Assessment Total Assessment is a certain percentage of the fair market value that is determined by local assessors to be the total taxable value of land and additions on the property. | Land | Improvement |
|---|---|---|---|---|
| 2024 | $6,658 | $31,609 | $2,451 | $29,158 |
| 2023 | $6,256 | $31,609 | $2,451 | $29,158 |
| 2022 | $6,256 | $31,609 | $2,451 | $29,158 |
| 2021 | $6,614 | $28,900 | $1,671 | $27,229 |
| 2020 | $6,632 | $28,900 | $1,671 | $27,229 |
| 2019 | $6,212 | $32,031 | $1,671 | $30,360 |
| 2018 | $4,639 | $22,559 | $1,448 | $21,111 |
| 2017 | $4,524 | $22,559 | $1,448 | $21,111 |
| 2016 | $4,458 | $22,559 | $1,448 | $21,111 |
| 2015 | $4,314 | $19,975 | $1,169 | $18,806 |
| 2014 | $4,234 | $19,975 | $1,169 | $18,806 |
| 2013 | $4,100 | $19,975 | $1,169 | $18,806 |
Source: Public Records
Map
Nearby Homes
- 10385 Dearlove Rd Unit 1I
- 701 Forum Square Unit 609
- 4150 Central Rd Unit 3E
- 600 Naples Ct Unit 510
- 600 Naples Ct Unit 107
- 600 Naples Ct Unit 608
- 3732 Capri Ct Unit T18A
- 625 Quincy Bridge Ln Unit 301
- 10347 Dearlove Rd Unit 302
- 4170 Cove Ln Unit 2B
- 917 Tamer Ln
- 9517 W Central Rd
- 1018 Castilian Ct Unit A205
- 4004 Denice Ct Unit 3
- 1026 Castilian Ct Unit D162
- 9411 Harrison St Unit 471494
- 3505 Linneman St
- 533 Cherry Ln
- 10009 Meadow Ln
- 518 Elder Ln
- 4224 Triumvera Dr Unit 12B
- 4220 Triumvera Dr Unit T10A
- 4226 Triumvera Dr Unit 13B
- 4218 Triumvera Dr Unit T10B
- 4228 Triumvera Dr Unit 14A
- 4216 Triumvera Dr Unit T9A
- 4101 Florence Way Unit 21A
- 4214 Triumvera Dr Unit T9B
- 4208 Triumvera Dr Unit T7A
- 4206 Triumvera Dr Unit T7B
- 10377 Dearlove Rd Unit 2208
- 10377 Dearlove Rd Unit 5210
- 10377 Dearlove Rd Unit 5204
- 10377 Dearlove Rd Unit 5104
- 10377 Dearlove Rd Unit 5102
- 10377 Dearlove Rd Unit 5211
- 10377 Dearlove Rd Unit 5107
- 10377 Dearlove Rd Unit 5106
- 10377 Dearlove Rd Unit 5108
- 10377 Dearlove Rd Unit 5109