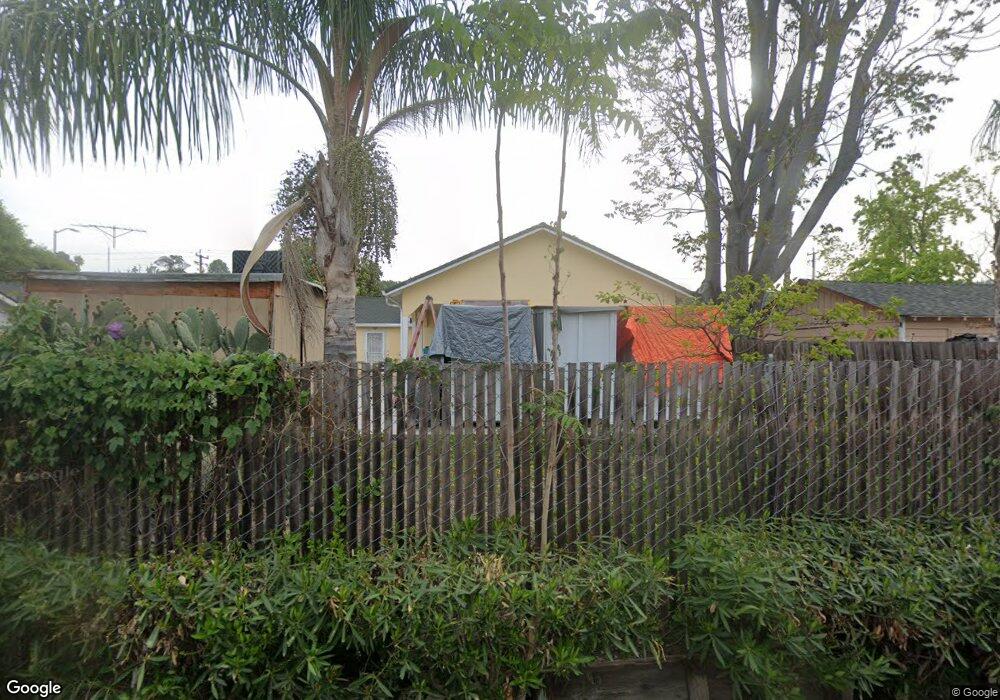
42269 Osgood Rd Fremont, CA 94539
Weibel NeighborhoodEstimated Value: $1,368,000 - $1,813,000
2
Beds
1
Bath
812
Sq Ft
$1,942/Sq Ft
Est. Value
About This Home
This home is located at 42269 Osgood Rd, Fremont, CA 94539 and is currently estimated at $1,577,267, approximately $1,942 per square foot. 42269 Osgood Rd is a home located in Alameda County with nearby schools including E. M. Grimmer Elementary School, John M. Horner Junior High School, and Irvington High School.
Ownership History
Date
Name
Owned For
Owner Type
Purchase Details
Closed on
Sep 5, 2019
Sold by
Saavedra Ariela Evelyn
Bought by
Saavedra Ariela Evelyn and Velasco Catalina Romero
Current Estimated Value
Purchase Details
Closed on
Mar 11, 2011
Sold by
Velasco Catalina Romero and Saavedra Ariela Evelyn
Bought by
Saavedra Ariela Evelyn
Purchase Details
Closed on
Nov 20, 2009
Sold by
Velasco Catalina Romero
Bought by
Velasco Catalina Romero and Saavedra Ariela Evelyn
Purchase Details
Closed on
Oct 23, 2006
Sold by
Velasco Catalina Romero
Bought by
The City Of Fremont
Purchase Details
Closed on
May 30, 2006
Sold by
Thygesen Ronald J and Agnes Thygesen 1996 Trust
Bought by
Velasco Catalina Romero
Purchase Details
Closed on
Aug 8, 1996
Sold by
Thygesen Agnes
Bought by
Thygesen Ronald J and Agnes Thygesen 1996 Trust
Create a Home Valuation Report for This Property
The Home Valuation Report is an in-depth analysis detailing your home's value as well as a comparison with similar homes in the area
Home Values in the Area
Average Home Value in this Area
Purchase History
| Date | Buyer | Sale Price | Title Company |
|---|---|---|---|
| Saavedra Ariela Evelyn | -- | None Available | |
| Saavedra Ariela Evelyn | -- | None Available | |
| Velasco Catalina Romero | -- | None Available | |
| The City Of Fremont | -- | Placer Title Company | |
| Velasco Catalina Romero | $460,000 | Fidelity National Title Co | |
| Thygesen Ronald J | -- | -- |
Source: Public Records
Tax History Compared to Growth
Tax History
| Year | Tax Paid | Tax Assessment Tax Assessment Total Assessment is a certain percentage of the fair market value that is determined by local assessors to be the total taxable value of land and additions on the property. | Land | Improvement |
|---|---|---|---|---|
| 2025 | $7,820 | $629,725 | $237,655 | $392,070 |
| 2024 | $7,820 | $617,380 | $232,996 | $384,384 |
| 2023 | $7,606 | $605,278 | $228,429 | $376,849 |
| 2022 | $7,500 | $593,411 | $223,951 | $369,460 |
| 2021 | $7,319 | $581,778 | $219,560 | $362,218 |
| 2020 | $7,314 | $575,816 | $217,310 | $358,506 |
| 2019 | $7,233 | $564,529 | $213,050 | $351,479 |
| 2018 | $7,091 | $553,465 | $208,875 | $344,590 |
| 2017 | $6,915 | $542,616 | $204,781 | $337,835 |
| 2016 | $6,795 | $531,979 | $200,766 | $331,213 |
| 2015 | $6,701 | $523,992 | $197,752 | $326,240 |
| 2014 | $6,584 | $513,729 | $193,879 | $319,850 |
Source: Public Records
Map
Nearby Homes
- 42111 Osgood Rd Unit 523
- 3872 Wildflower Common Unit 27
- 3800 Adams Ave
- 3923 Wildflower Common Unit 19
- 3918 Fossano Common
- 42759 Newport Dr
- 41212 Fremont Blvd
- 2785 Washington Blvd
- 3207 Washington Blvd
- 41538 Casabella Common
- 41620 Beatrice St
- 41392 Beatrice St
- 43270 Newport Dr
- 3331 Union St
- 4309 Bora Ave
- 2851 Finca Terrace
- 42077 Miranda St
- 41519 Apricot Ln
- 40769 Squill Common
- 41411 Apricot Ln
- 42255 Osgood Rd
- 42281 Osgood Rd
- 42241 Osgood Rd
- 42223 Osgood Rd
- 42282 Osgood Rd
- 42345 Osgood Rd
- 42218 Osgood Rd
- 42111 Osgood Rd
- 42111 Osgood Rd
- 42111 Osgood Rd
- 42111 Osgood Rd
- 42111 Osgood Rd
- 42111 Osgood Rd
- 42183 Osgood Rd
- 42359 Osgood Rd
- 42111 Osgood Rd Unit 209
- 42111 Osgood Rd Unit 412
- 42111 Osgood Rd Unit 501
- 42111 Osgood Rd Unit 312
- 42111 Osgood Rd Unit 202