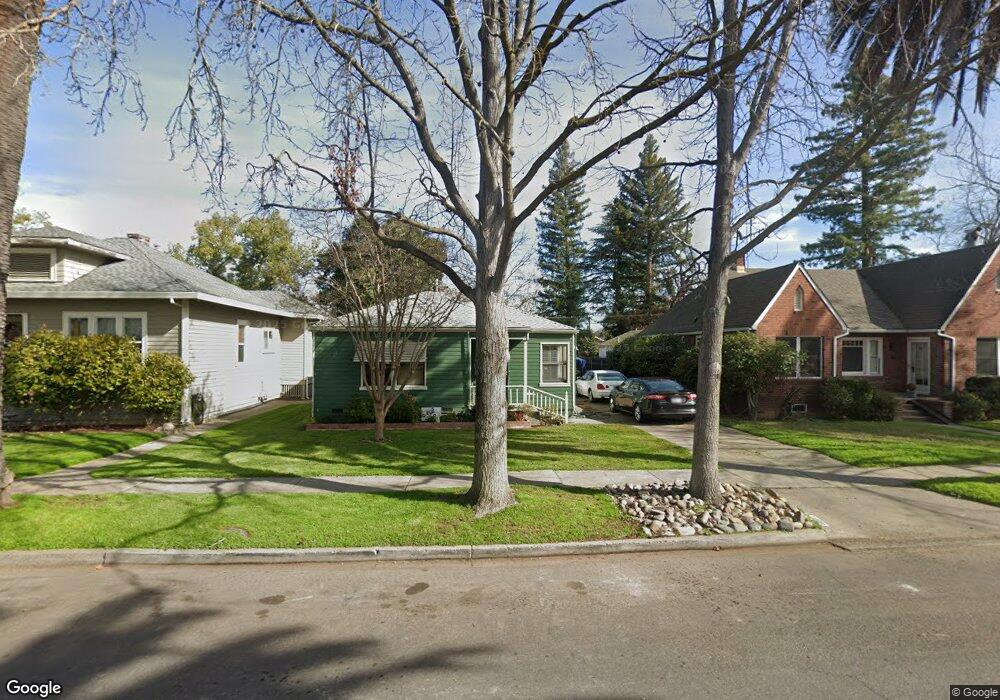
4227 54th St Sacramento, CA 95820
Colonial Heights NeighborhoodEstimated Value: $353,000 - $554,000
2
Beds
2
Baths
1,677
Sq Ft
$264/Sq Ft
Est. Value
About This Home
This home is located at 4227 54th St, Sacramento, CA 95820 and is currently estimated at $442,943, approximately $264 per square foot. 4227 54th St is a home located in Sacramento County with nearby schools including Mark Twain Elementary School, Umoja International Academy, and Hiram W. Johnson High School.
Ownership History
Date
Name
Owned For
Owner Type
Purchase Details
Closed on
Oct 7, 2016
Sold by
Lopez Diane Joan
Bought by
Lopez Anthony J and Lopez Talle S
Current Estimated Value
Purchase Details
Closed on
Jun 25, 2007
Sold by
Lopez Diane Joan and Lopez Joan D
Bought by
Lopez Diane Joan
Home Financials for this Owner
Home Financials are based on the most recent Mortgage that was taken out on this home.
Original Mortgage
$120,000
Interest Rate
10.39%
Mortgage Type
New Conventional
Create a Home Valuation Report for This Property
The Home Valuation Report is an in-depth analysis detailing your home's value as well as a comparison with similar homes in the area
Home Values in the Area
Average Home Value in this Area
Purchase History
| Date | Buyer | Sale Price | Title Company |
|---|---|---|---|
| Lopez Anthony J | -- | Orange Coast Title Company O | |
| Lopez Diane Joan | -- | Fidelity National Title Co | |
| Lopez Diane Joan | -- | Fidelity National Title Co |
Source: Public Records
Mortgage History
| Date | Status | Borrower | Loan Amount |
|---|---|---|---|
| Closed | Lopez Diane Joan | $120,000 |
Source: Public Records
Tax History Compared to Growth
Tax History
| Year | Tax Paid | Tax Assessment Tax Assessment Total Assessment is a certain percentage of the fair market value that is determined by local assessors to be the total taxable value of land and additions on the property. | Land | Improvement |
|---|---|---|---|---|
| 2025 | $761 | $50,339 | $9,770 | $40,569 |
| 2024 | $761 | $49,353 | $9,579 | $39,774 |
| 2023 | $743 | $48,387 | $9,392 | $38,995 |
| 2022 | $731 | $47,439 | $9,208 | $38,231 |
| 2021 | $701 | $46,510 | $9,028 | $37,482 |
| 2020 | $2,064 | $46,034 | $8,936 | $37,098 |
| 2019 | $688 | $45,132 | $8,761 | $36,371 |
| 2018 | $4,088 | $285,600 | $76,500 | $209,100 |
| 2017 | $3,440 | $280,000 | $75,000 | $205,000 |
| 2016 | $2,260 | $42,531 | $8,257 | $34,274 |
| 2015 | $1,219 | $41,893 | $8,133 | $33,760 |
| 2014 | $1,952 | $41,073 | $7,974 | $33,099 |
Source: Public Records
Map
Nearby Homes