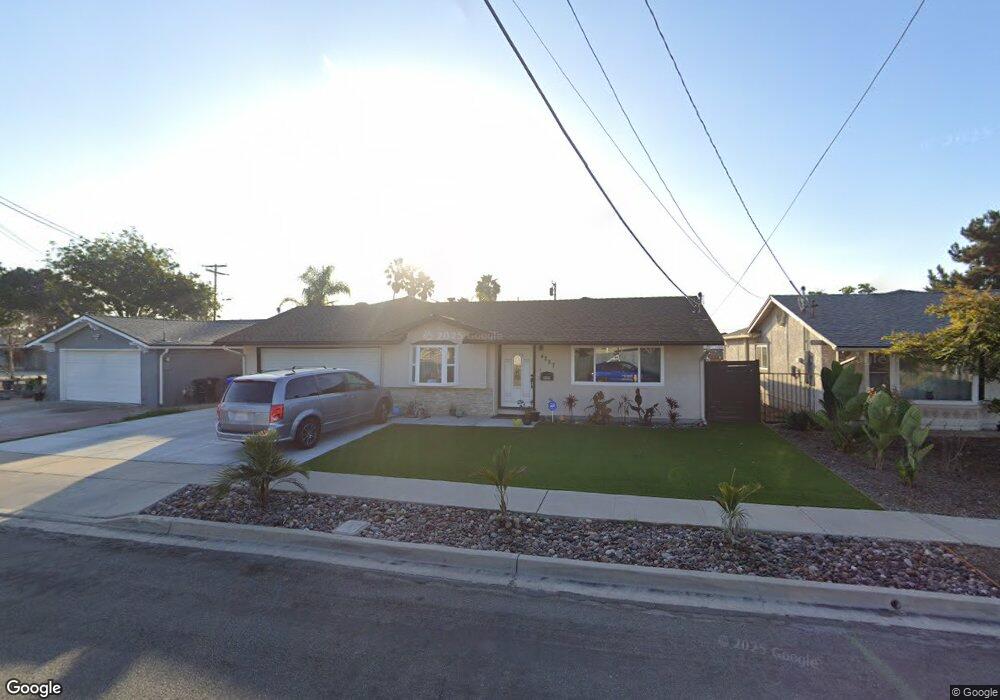
4227 Seri St San Diego, CA 92117
North Clairemont NeighborhoodEstimated Value: $1,014,000 - $1,356,000
3
Beds
2
Baths
1,747
Sq Ft
$684/Sq Ft
Est. Value
About This Home
This home is located at 4227 Seri St, San Diego, CA 92117 and is currently estimated at $1,195,296, approximately $684 per square foot. 4227 Seri St is a home located in San Diego County with nearby schools including Field Elementary School, Innovation Middle School, and Madison High School.
Ownership History
Date
Name
Owned For
Owner Type
Purchase Details
Closed on
Jan 31, 2012
Sold by
Whelan John
Bought by
Whelan John Lewis
Current Estimated Value
Purchase Details
Closed on
Dec 30, 2011
Sold by
Whelan John and Petruccelli Sue Ann
Bought by
Whelan John
Purchase Details
Closed on
Jul 28, 2003
Sold by
Whelan Joln
Bought by
Whelan Joln and Petruccelli Sue Ann
Purchase Details
Closed on
Jul 2, 1997
Sold by
Schafer Stuart D
Bought by
Whelan John
Home Financials for this Owner
Home Financials are based on the most recent Mortgage that was taken out on this home.
Original Mortgage
$138,400
Outstanding Balance
$20,185
Interest Rate
7.7%
Estimated Equity
$1,175,111
Purchase Details
Closed on
Aug 17, 1990
Purchase Details
Closed on
Oct 17, 1985
Create a Home Valuation Report for This Property
The Home Valuation Report is an in-depth analysis detailing your home's value as well as a comparison with similar homes in the area
Home Values in the Area
Average Home Value in this Area
Purchase History
| Date | Buyer | Sale Price | Title Company |
|---|---|---|---|
| Whelan John Lewis | -- | None Available | |
| Whelan John | -- | None Available | |
| Whelan Joln | -- | -- | |
| Whelan John | $173,000 | First American Title | |
| -- | $198,900 | -- | |
| -- | $131,000 | -- |
Source: Public Records
Mortgage History
| Date | Status | Borrower | Loan Amount |
|---|---|---|---|
| Open | Whelan John | $138,400 |
Source: Public Records
Tax History Compared to Growth
Tax History
| Year | Tax Paid | Tax Assessment Tax Assessment Total Assessment is a certain percentage of the fair market value that is determined by local assessors to be the total taxable value of land and additions on the property. | Land | Improvement |
|---|---|---|---|---|
| 2025 | $3,862 | $324,997 | $162,023 | $162,974 |
| 2024 | $3,862 | $318,626 | $158,847 | $159,779 |
| 2023 | $3,775 | $312,380 | $155,733 | $156,647 |
| 2022 | $3,673 | $306,256 | $152,680 | $153,576 |
| 2021 | $3,646 | $300,252 | $149,687 | $150,565 |
| 2020 | $3,601 | $297,175 | $148,153 | $149,022 |
| 2019 | $3,536 | $291,349 | $145,249 | $146,100 |
| 2018 | $3,305 | $285,637 | $142,401 | $143,236 |
| 2017 | $3,225 | $280,037 | $139,609 | $140,428 |
| 2016 | $3,171 | $274,547 | $136,872 | $137,675 |
| 2015 | $3,124 | $270,424 | $134,817 | $135,607 |
| 2014 | $3,074 | $265,128 | $132,177 | $132,951 |
Source: Public Records
Map
Nearby Homes
- 4380 Rolfe Rd
- 4203 Tolowa St
- 4182 Seri St
- 4576 Onondaga Ave
- 4226 Mount Voss Dr
- 4472 Mount Lindsey Ave
- 4527 Chinook Ct
- 3701 Tavara Cir
- 3582 Hatteras Ave
- 3571 Idlewild Way
- 4772 Mount Gaywas Dr
- 4695 Mount Armet Dr
- 4527 Kickapoo Ct
- 4915 Mount Gaywas Dr
- 4150 Taos Dr
- 4501 Bannock Ave
- 4141 Mount Bigelow Way
- 4851 Cole St Unit 1
- 3476 Ogalala Ave
- 4731 Norwalk Ave