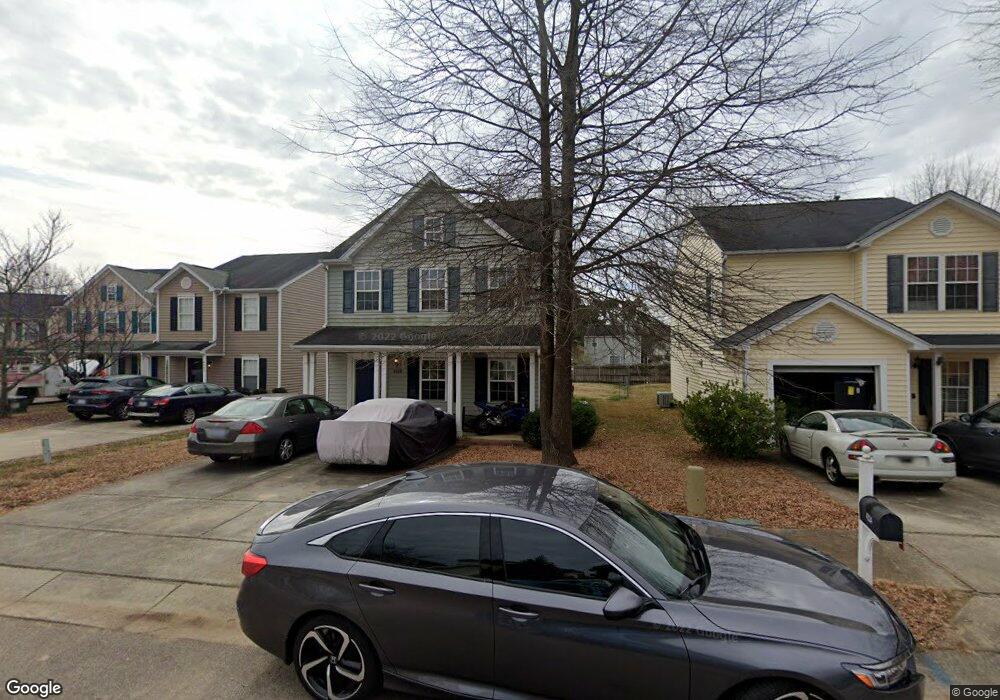
4228 Tensity Dr Raleigh, NC 27604
Northeast Raleigh NeighborhoodEstimated Value: $299,000 - $330,000
3
Beds
3
Baths
1,638
Sq Ft
$192/Sq Ft
Est. Value
About This Home
This home is located at 4228 Tensity Dr, Raleigh, NC 27604 and is currently estimated at $314,707, approximately $192 per square foot. 4228 Tensity Dr is a home located in Wake County with nearby schools including Durant Road Elementary, Durant Road Middle, and Millbrook High School.
Ownership History
Date
Name
Owned For
Owner Type
Purchase Details
Closed on
Oct 19, 2009
Sold by
Secretary Of Housing & Urban Development
Bought by
Martin Orry
Current Estimated Value
Home Financials for this Owner
Home Financials are based on the most recent Mortgage that was taken out on this home.
Original Mortgage
$103,098
Outstanding Balance
$67,218
Interest Rate
5.05%
Mortgage Type
FHA
Estimated Equity
$247,489
Purchase Details
Closed on
Jun 29, 2009
Sold by
Rodriguez Gilberto A
Bought by
Secretary Of Housing & Urban Development
Purchase Details
Closed on
Sep 15, 2003
Sold by
Anderson Homes Inc
Bought by
Rodriguez Gilberto Antonio
Home Financials for this Owner
Home Financials are based on the most recent Mortgage that was taken out on this home.
Original Mortgage
$137,837
Interest Rate
6.24%
Mortgage Type
FHA
Purchase Details
Closed on
Mar 11, 2003
Sold by
Ashley Rbs Llc
Bought by
Anderson Homes Inc
Home Financials for this Owner
Home Financials are based on the most recent Mortgage that was taken out on this home.
Original Mortgage
$147,500
Interest Rate
5.86%
Create a Home Valuation Report for This Property
The Home Valuation Report is an in-depth analysis detailing your home's value as well as a comparison with similar homes in the area
Home Values in the Area
Average Home Value in this Area
Purchase History
| Date | Buyer | Sale Price | Title Company |
|---|---|---|---|
| Martin Orry | -- | None Available | |
| Secretary Of Housing & Urban Development | $146,647 | None Available | |
| Rodriguez Gilberto Antonio | $140,000 | -- | |
| Anderson Homes Inc | $324,500 | -- |
Source: Public Records
Mortgage History
| Date | Status | Borrower | Loan Amount |
|---|---|---|---|
| Open | Martin Orry | $103,098 | |
| Previous Owner | Rodriguez Gilberto Antonio | $137,837 | |
| Previous Owner | Anderson Homes Inc | $147,500 |
Source: Public Records
Tax History
| Year | Tax Paid | Tax Assessment Tax Assessment Total Assessment is a certain percentage of the fair market value that is determined by local assessors to be the total taxable value of land and additions on the property. | Land | Improvement |
|---|---|---|---|---|
| 2025 | $2,823 | $321,380 | $90,000 | $231,380 |
| 2024 | $2,811 | $321,380 | $90,000 | $231,380 |
Source: Public Records
Map
Nearby Homes
- 2115 Timken Ct
- 4204 Belington Ct
- 2400 Dorety Place
- 3505 Skycrest Dr
- 1909 Kushima Ct
- 2704 Rockbridge Ct
- 2848 Roundleaf Ct
- 2300 Oakwood Meadows Ct
- 2302 Oakwood Meadows Ct
- 2307 Oakwood Meadows Ct
- 2305 Oakwood Meadows Ct
- Jackson Plan at Elm Grove - City Collection
- 2303 Oakwood Meadows Ct
- 3608 Elm Grove Ln
- 2309 Oakwood Meadows Ct
- 3606 Elm Grove Ln
- 3600 Elm Grove Ln
- 3709 Elm Grove Ln
- 3604 Elm Grove Ln
- 4401 Liverpool Ln
- 4232 Tensity Dr
- 4224 Tensity Dr
- 4220 Tensity Dr
- 4216 Tensity Dr
- 4240 Tensity Dr
- 4229 Tensity Dr
- 4212 Tensity Dr
- 4244 Tensity Dr
- 4233 Tensity Dr
- 4221 Tensity Dr
- 4245 Tensity Dr
- 4217 Tensity Dr
- 4237 Tensity Dr
- 4208 Tensity Dr
- 4321 Standing Rock Way
- 4241 Tensity Dr
- 4213 Tensity Dr
- 4317 Standing Rock Way
- 4313 Standing Rock Way
- 4236 Palafox Ct
Your Personal Tour Guide
Ask me questions while you tour the home.