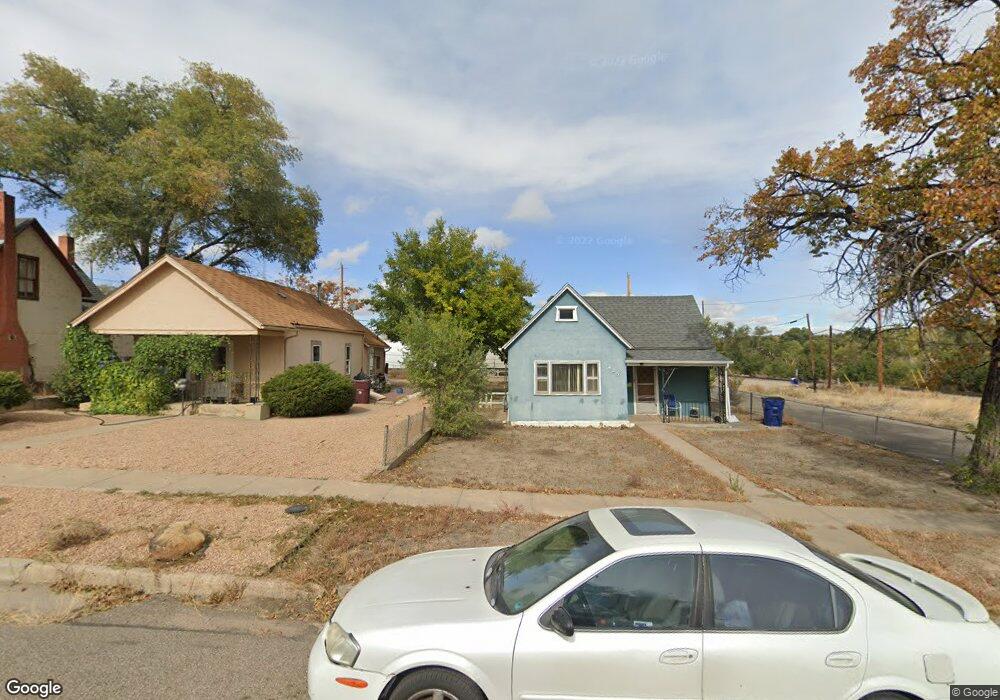
423 E Ash St Pueblo, CO 81003
Downtown NeighborhoodEstimated Value: $110,000 - $152,000
2
Beds
1
Bath
912
Sq Ft
$150/Sq Ft
Est. Value
About This Home
This home is located at 423 E Ash St, Pueblo, CO 81003 and is currently estimated at $137,035, approximately $150 per square foot. 423 E Ash St is a home located in Pueblo County with nearby schools including Bradford Elementary School, Risley International Academy of Innovation, and Centennial High School.
Ownership History
Date
Name
Owned For
Owner Type
Purchase Details
Closed on
Jan 6, 2021
Sold by
Langoni Anthony J and Langoni J A
Bought by
Langoni Anthony J and Langoni Gianna R
Current Estimated Value
Purchase Details
Closed on
Jan 20, 2012
Sold by
Langoni Ellen and Langoni Anthony J
Bought by
Langoni Ii Anthony J and Langoni Mario T
Purchase Details
Closed on
Aug 26, 2002
Sold by
Langoni Anthony J + Ellen
Bought by
Same
Purchase Details
Closed on
Jul 16, 2002
Sold by
Madrid J J and Madrid Adair L
Bought by
Langoni Anthony J + Ellen
Purchase Details
Closed on
Feb 5, 1992
Sold by
Madrid J J and Madrid Adair L
Bought by
Madrid J J and Madrid Adair L
Purchase Details
Closed on
Oct 31, 1982
Sold by
Madrid Jo Ann
Bought by
Madrid J J and Madrid Adair L
Purchase Details
Closed on
Nov 30, 1977
Sold by
Langoni Charles
Bought by
Langoni and Madrid
Create a Home Valuation Report for This Property
The Home Valuation Report is an in-depth analysis detailing your home's value as well as a comparison with similar homes in the area
Home Values in the Area
Average Home Value in this Area
Purchase History
| Date | Buyer | Sale Price | Title Company |
|---|---|---|---|
| Langoni Anthony J | -- | None Listed On Document | |
| Langoni Ii Anthony J | -- | None Available | |
| Same | -- | -- | |
| Langoni Anthony J + Ellen | -- | -- | |
| Madrid J J | -- | -- | |
| Madrid J J | -- | -- | |
| Langoni | -- | -- |
Source: Public Records
Tax History
| Year | Tax Paid | Tax Assessment Tax Assessment Total Assessment is a certain percentage of the fair market value that is determined by local assessors to be the total taxable value of land and additions on the property. | Land | Improvement |
|---|---|---|---|---|
| 2024 | $429 | $4,320 | -- | -- |
| 2023 | $434 | $8,010 | $1,010 | $7,000 |
| 2022 | $455 | $4,580 | $360 | $4,220 |
| 2021 | $469 | $4,710 | $370 | $4,340 |
| 2020 | $303 | $4,710 | $370 | $4,340 |
| 2019 | $302 | $2,995 | $157 | $2,838 |
| 2018 | $189 | $2,086 | $158 | $1,928 |
| 2017 | $191 | $2,086 | $158 | $1,928 |
| 2016 | $186 | $2,047 | $174 | $1,873 |
| 2015 | $185 | $2,047 | $174 | $1,873 |
| 2014 | $108 | $2,390 | $174 | $2,216 |
Source: Public Records
Map
Nearby Homes
- 615 E 1st St
- 225 N Bradford Ave
- 711 E 3rd St
- 806 E 3rd St
- 904 E 1st St
- 903 Catalpa St
- 915 E River St
- 829 E 3rd St
- 211 W 2nd St
- 1001 E 2nd St
- 102 S Union Ave Unit 205
- 224 W 3rd St
- 812 E 6th St
- 224 - 228 W 3rd St Unit 7
- 516 N Hudson Ave
- 1015 E 3rd St
- 221 E 4th St Unit 223
- 912 E 6th St
- TBD E Beech St
- 1012 Fir St
Your Personal Tour Guide
Ask me questions while you tour the home.