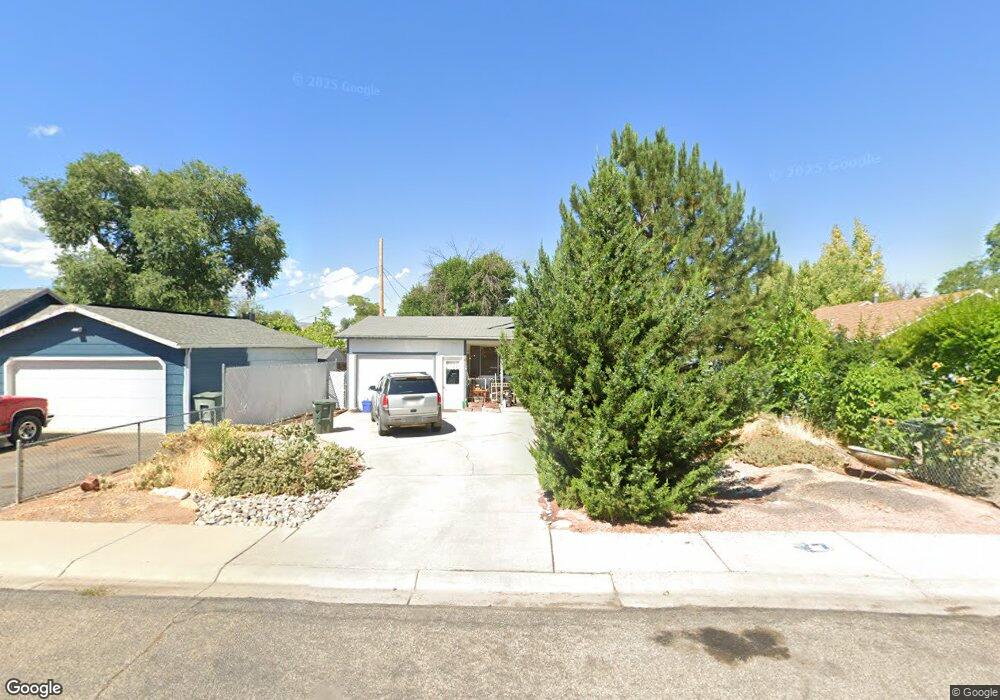
423 N 18th St Grand Junction, CO 81501
Downtown Grand Junction NeighborhoodEstimated Value: $315,228 - $338,000
3
Beds
2
Baths
1,092
Sq Ft
$301/Sq Ft
Est. Value
About This Home
This home is located at 423 N 18th St, Grand Junction, CO 81501 and is currently estimated at $329,057, approximately $301 per square foot. 423 N 18th St is a home located in Mesa County with nearby schools including Chipeta Elementary School, East Middle School, and West Middle School.
Ownership History
Date
Name
Owned For
Owner Type
Purchase Details
Closed on
Apr 20, 2005
Sold by
Vroman Kay
Bought by
Severson Karen E
Current Estimated Value
Home Financials for this Owner
Home Financials are based on the most recent Mortgage that was taken out on this home.
Original Mortgage
$127,351
Outstanding Balance
$66,187
Interest Rate
5.89%
Mortgage Type
FHA
Estimated Equity
$262,870
Purchase Details
Closed on
Sep 1, 1995
Sold by
Adams Laura Jean
Bought by
Severson Karen E
Create a Home Valuation Report for This Property
The Home Valuation Report is an in-depth analysis detailing your home's value as well as a comparison with similar homes in the area
Home Values in the Area
Average Home Value in this Area
Purchase History
| Date | Buyer | Sale Price | Title Company |
|---|---|---|---|
| Severson Karen E | $129,150 | First American Heritage Titl | |
| Severson Karen E | $82,300 | -- |
Source: Public Records
Mortgage History
| Date | Status | Borrower | Loan Amount |
|---|---|---|---|
| Open | Severson Karen E | $127,351 | |
| Closed | Severson Karen E | $3,597 |
Source: Public Records
Tax History Compared to Growth
Tax History
| Year | Tax Paid | Tax Assessment Tax Assessment Total Assessment is a certain percentage of the fair market value that is determined by local assessors to be the total taxable value of land and additions on the property. | Land | Improvement |
|---|---|---|---|---|
| 2024 | $1,095 | $15,490 | $4,600 | $10,890 |
| 2023 | $1,095 | $15,490 | $4,600 | $10,890 |
| 2022 | $1,086 | $15,060 | $3,820 | $11,240 |
| 2021 | $1,090 | $15,500 | $3,930 | $11,570 |
| 2020 | $863 | $12,560 | $3,580 | $8,980 |
| 2019 | $816 | $12,560 | $3,580 | $8,980 |
| 2018 | $745 | $10,530 | $3,240 | $7,290 |
| 2017 | $742 | $10,530 | $3,240 | $7,290 |
| 2016 | $699 | $11,150 | $3,380 | $7,770 |
| 2015 | $709 | $11,150 | $3,380 | $7,770 |
| 2014 | $659 | $10,450 | $2,790 | $7,660 |
Source: Public Records
Map
Nearby Homes