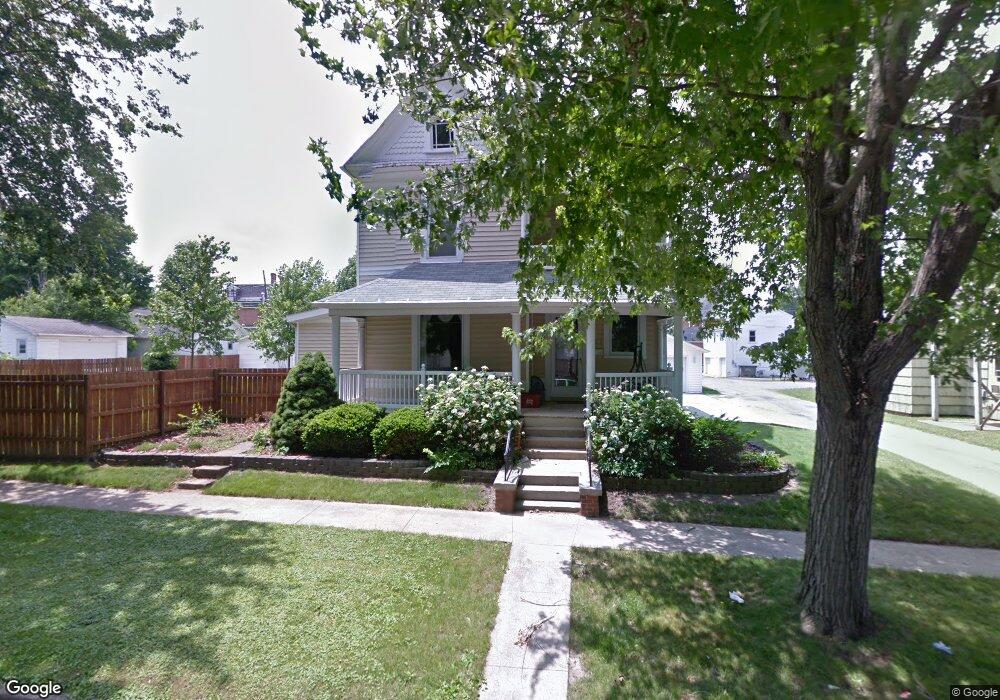
423 N Wayne St Kenton, OH 43326
Estimated Value: $203,000 - $259,000
4
Beds
2
Baths
2,234
Sq Ft
$103/Sq Ft
Est. Value
About This Home
This home is located at 423 N Wayne St, Kenton, OH 43326 and is currently estimated at $229,160, approximately $102 per square foot. 423 N Wayne St is a home located in Hardin County with nearby schools including Kenton Elementary School, Kenton Middle School, and Kenton High School.
Ownership History
Date
Name
Owned For
Owner Type
Purchase Details
Closed on
Mar 19, 2010
Sold by
King Stephen T and King Andrea L
Bought by
Shoemaker Wade
Current Estimated Value
Home Financials for this Owner
Home Financials are based on the most recent Mortgage that was taken out on this home.
Original Mortgage
$117,727
Outstanding Balance
$79,072
Interest Rate
5.25%
Mortgage Type
FHA
Estimated Equity
$150,088
Purchase Details
Closed on
Sep 9, 1994
Bought by
King Stephen T and King Andrea
Create a Home Valuation Report for This Property
The Home Valuation Report is an in-depth analysis detailing your home's value as well as a comparison with similar homes in the area
Home Values in the Area
Average Home Value in this Area
Purchase History
| Date | Buyer | Sale Price | Title Company |
|---|---|---|---|
| Shoemaker Wade | $119,900 | Chicago Title | |
| King Stephen T | $83,000 | -- |
Source: Public Records
Mortgage History
| Date | Status | Borrower | Loan Amount |
|---|---|---|---|
| Open | Shoemaker Wade | $117,727 |
Source: Public Records
Tax History Compared to Growth
Tax History
| Year | Tax Paid | Tax Assessment Tax Assessment Total Assessment is a certain percentage of the fair market value that is determined by local assessors to be the total taxable value of land and additions on the property. | Land | Improvement |
|---|---|---|---|---|
| 2024 | $2,581 | $60,080 | $2,330 | $57,750 |
| 2023 | $2,581 | $60,080 | $2,330 | $57,750 |
| 2022 | $2,230 | $48,300 | $1,740 | $46,560 |
| 2021 | $2,255 | $48,660 | $1,740 | $46,920 |
| 2020 | $1,890 | $47,020 | $1,740 | $45,280 |
| 2019 | $1,503 | $38,560 | $1,660 | $36,900 |
| 2018 | $1,506 | $38,560 | $1,660 | $36,900 |
| 2017 | $1,321 | $38,560 | $1,660 | $36,900 |
| 2016 | $1,147 | $30,740 | $2,350 | $28,390 |
| 2015 | $1,108 | $30,740 | $2,350 | $28,390 |
| 2014 | $1,136 | $30,740 | $2,350 | $28,390 |
| 2013 | $1,236 | $32,420 | $2,350 | $30,070 |
Source: Public Records
Map
Nearby Homes
- 416 N Cherry St
- 328 N Detroit St
- 233 N Main St
- 0 N Barron St
- 215 N Main St
- 416 E Eliza St
- 503 Jennings St
- 310 N Market St
- 219 W Carrol St
- 299 Marie Ave
- 509 E Carrol St
- 0 Gilmore St
- 416 Center St
- 424 W Carrol St
- 121 S High St
- 104 Oak Ln Unit 15
- 609 W North St
- 777 Maydoll Dr
- 513 E Franklin St
- 39 Grape St