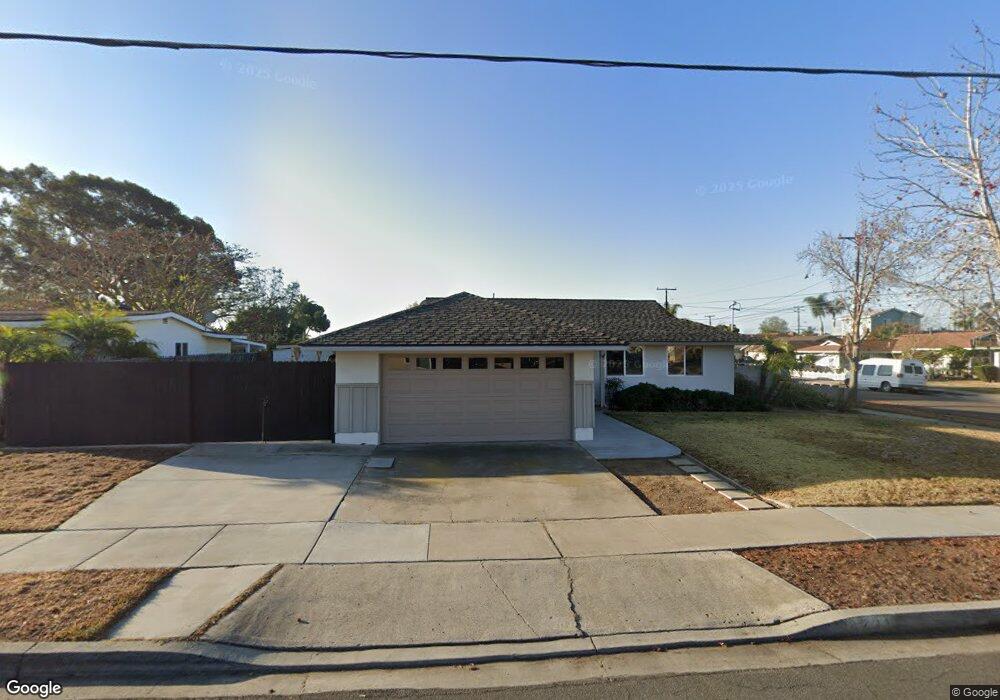
4231 Cindy St San Diego, CA 92117
North Clairemont NeighborhoodEstimated Value: $997,988 - $1,100,000
3
Beds
2
Baths
1,100
Sq Ft
$945/Sq Ft
Est. Value
About This Home
This home is located at 4231 Cindy St, San Diego, CA 92117 and is currently estimated at $1,039,997, approximately $945 per square foot. 4231 Cindy St is a home located in San Diego County with nearby schools including Field Elementary School, Innovation Middle School, and Madison High School.
Ownership History
Date
Name
Owned For
Owner Type
Purchase Details
Closed on
Oct 12, 2016
Sold by
Ricci Scott
Bought by
Ricci Scott Derrick
Current Estimated Value
Purchase Details
Closed on
Jan 30, 2003
Sold by
Ricci Jennifer Ann
Bought by
Ricci Scott
Home Financials for this Owner
Home Financials are based on the most recent Mortgage that was taken out on this home.
Original Mortgage
$113,750
Outstanding Balance
$48,040
Interest Rate
5.76%
Mortgage Type
Purchase Money Mortgage
Estimated Equity
$991,957
Purchase Details
Closed on
Feb 24, 1994
Sold by
Griffin John J and Griffin Marilyn R
Bought by
Ricci Scott and Ricci Rex J
Home Financials for this Owner
Home Financials are based on the most recent Mortgage that was taken out on this home.
Original Mortgage
$126,000
Interest Rate
7.15%
Purchase Details
Closed on
Jun 28, 1989
Purchase Details
Closed on
Sep 21, 1987
Purchase Details
Closed on
Apr 27, 1984
Create a Home Valuation Report for This Property
The Home Valuation Report is an in-depth analysis detailing your home's value as well as a comparison with similar homes in the area
Home Values in the Area
Average Home Value in this Area
Purchase History
| Date | Buyer | Sale Price | Title Company |
|---|---|---|---|
| Ricci Scott Derrick | -- | None Available | |
| Ricci Scott | -- | American Title Co | |
| Ricci Scott | -- | American Title Co | |
| Ricci Scott | $146,000 | Orange Coast Title Company | |
| -- | $175,300 | -- | |
| -- | $130,000 | -- | |
| -- | $102,400 | -- |
Source: Public Records
Mortgage History
| Date | Status | Borrower | Loan Amount |
|---|---|---|---|
| Open | Ricci Scott | $113,750 | |
| Closed | Ricci Scott | $113,750 | |
| Closed | Ricci Scott | $126,000 |
Source: Public Records
Tax History Compared to Growth
Tax History
| Year | Tax Paid | Tax Assessment Tax Assessment Total Assessment is a certain percentage of the fair market value that is determined by local assessors to be the total taxable value of land and additions on the property. | Land | Improvement |
|---|---|---|---|---|
| 2025 | $2,937 | $248,117 | $135,956 | $112,161 |
| 2024 | $2,937 | $243,253 | $133,291 | $109,962 |
| 2023 | $2,869 | $238,484 | $130,678 | $107,806 |
| 2022 | $2,792 | $233,809 | $128,116 | $105,693 |
| 2021 | $2,771 | $229,225 | $125,604 | $103,621 |
| 2020 | $2,737 | $226,876 | $124,317 | $102,559 |
| 2019 | $2,687 | $222,429 | $121,880 | $100,549 |
| 2018 | $2,512 | $218,069 | $119,491 | $98,578 |
| 2017 | $2,450 | $213,795 | $117,149 | $96,646 |
| 2016 | $2,409 | $209,603 | $114,852 | $94,751 |
| 2015 | $2,372 | $206,455 | $113,127 | $93,328 |
| 2014 | $2,334 | $202,411 | $110,911 | $91,500 |
Source: Public Records
Map
Nearby Homes
- 4380 Rolfe Rd
- 4182 Seri St
- 4203 Tolowa St
- 4587 Rolfe Rd
- 4576 Onondaga Ave
- 4472 Mount Lindsey Ave
- 4527 Chinook Ct
- 4226 Mount Voss Dr
- 3582 Hatteras Ave
- 3701 Tavara Cir
- 4772 Mount Gaywas Dr
- 4501 Bannock Ave
- 4851 Cole St Unit 1
- 4527 Kickapoo Ct
- 4401-3 Clairemont Mesa Blvd
- 4915 Mount Gaywas Dr
- 4875 Cole St Unit 69
- 4875 Cole St Unit 51
- 4509 Manitou Way
- 4951 57 Genesee Ave
- 4481 Donald Ave
- 4241 Cindy St
- 4473 Donald Ave
- 4503 Donald Ave
- 4251 Cindy St
- 4488 Donald Ave
- 4242 Cindy St
- 4502 Donald Ave
- 4480 Donald Ave
- 4465 Donald Ave
- 4252 Cindy St
- 4514 Donald Ave Unit 1
- 4261 Cindy St
- 4515 Donald Ave
- 4472 Donald Ave
- 4489 Rolfe Rd
- 4497 Rolfe Rd
- 4481 Rolfe Rd
- 4502 Miami Way
- 4457 Donald Ave