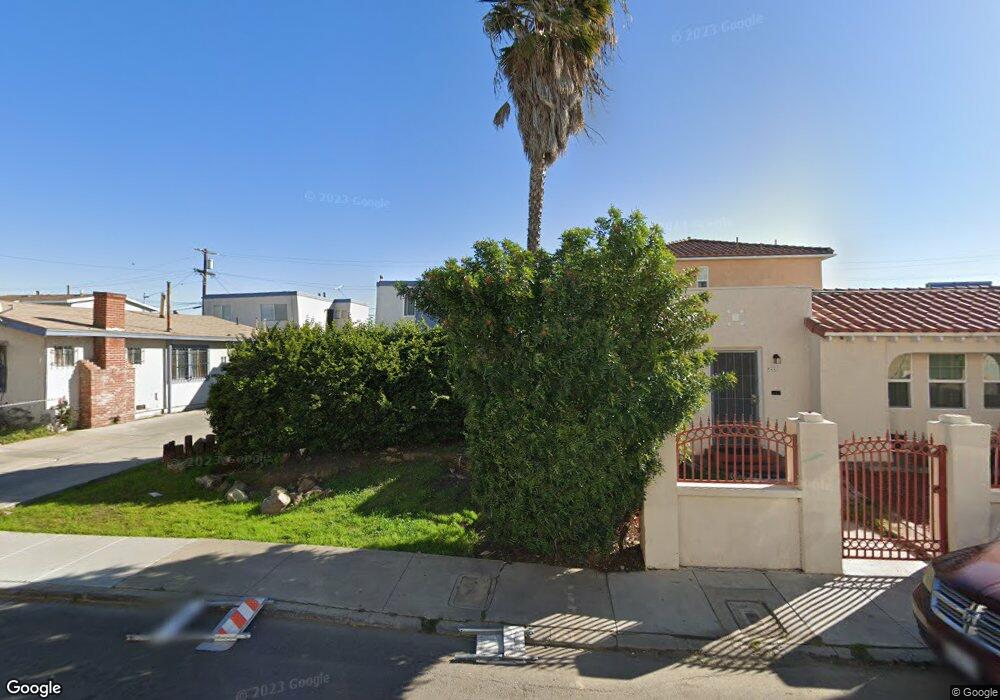
4233 39th St Unit B San Diego, CA 92105
Corridor NeighborhoodEstimated Value: $354,670 - $460,000
1
Bed
1
Bath
620
Sq Ft
$649/Sq Ft
Est. Value
About This Home
This home is located at 4233 39th St Unit B, San Diego, CA 92105 and is currently estimated at $402,668, approximately $649 per square foot. 4233 39th St Unit B is a home located in San Diego County with nearby schools including Central Elementary School, Wilson Middle School, and Herbert Hoover High School.
Ownership History
Date
Name
Owned For
Owner Type
Purchase Details
Closed on
Jan 17, 2007
Sold by
Lickert Lloyd L
Bought by
Lickert Lloyd L
Current Estimated Value
Purchase Details
Closed on
Jul 23, 1984
Sold by
Murad Karen A and Lickert Lloyd L
Bought by
Lickert Lloyd L
Home Financials for this Owner
Home Financials are based on the most recent Mortgage that was taken out on this home.
Original Mortgage
$21,000
Interest Rate
9.16%
Create a Home Valuation Report for This Property
The Home Valuation Report is an in-depth analysis detailing your home's value as well as a comparison with similar homes in the area
Home Values in the Area
Average Home Value in this Area
Purchase History
| Date | Buyer | Sale Price | Title Company |
|---|---|---|---|
| Lickert Lloyd L | -- | None Available | |
| Lickert Lloyd L | -- | Southland Title Corporation |
Source: Public Records
Mortgage History
| Date | Status | Borrower | Loan Amount |
|---|---|---|---|
| Previous Owner | Lickert Lloyd L | $21,000 |
Source: Public Records
Tax History Compared to Growth
Tax History
| Year | Tax Paid | Tax Assessment Tax Assessment Total Assessment is a certain percentage of the fair market value that is determined by local assessors to be the total taxable value of land and additions on the property. | Land | Improvement |
|---|---|---|---|---|
| 2025 | $908 | $71,856 | $33,576 | $38,280 |
| 2024 | $908 | $70,448 | $32,918 | $37,530 |
| 2023 | $887 | $69,068 | $32,273 | $36,795 |
| 2022 | $864 | $67,715 | $31,641 | $36,074 |
| 2021 | $858 | $66,388 | $31,021 | $35,367 |
| 2020 | $849 | $65,708 | $30,703 | $35,005 |
| 2019 | $834 | $64,420 | $30,101 | $34,319 |
| 2018 | $782 | $63,158 | $29,511 | $33,647 |
| 2017 | $82 | $61,921 | $28,933 | $32,988 |
| 2016 | $751 | $60,708 | $28,366 | $32,342 |
| 2015 | $740 | $59,797 | $27,940 | $31,857 |
| 2014 | $729 | $58,626 | $27,393 | $31,233 |
Source: Public Records
Map
Nearby Homes
- 4233 39th St Unit C
- 4342 39th St
- 3737 Orange Ave
- 4164 38th St
- 4119 Orange Ave
- 4411 Mcclintock St
- 4174 Marlborough Ave Unit 8
- 4041 38th St
- 4164 Cherokee Ave Unit G
- 3909 Monroe Ave Unit 101
- 4102 Cherokee Ave
- 3848 Monroe Ave
- 4358-64 36th St
- 4153 Wilson Ave
- 3890 37th St
- 4146-50 Monroe Ave
- 4344 Van Dyke Ave
- 3846 38th St Unit 5
- 3846 38th St Unit 3
- 4332 Wilson Ave
- 4241 39th St Unit 4241
- 4233 39th St Unit D
- 4233 39th St Unit A
- 4243 39th St Unit B
- 4243 39th St Unit A
- 4227 39th St
- 4219 39th St
- 4251 39th St
- 4253 39th St
- 4230 40th St Unit 32
- 4226 40th St
- 4246 40th St
- 4215 39th St
- 4255 39th St
- 4242-4252 St
- 4259 - 426 39th St
- 4259 39th St Unit 61
- 4242 40th St
- 4220 40th St Unit 22
- 4252 40th St