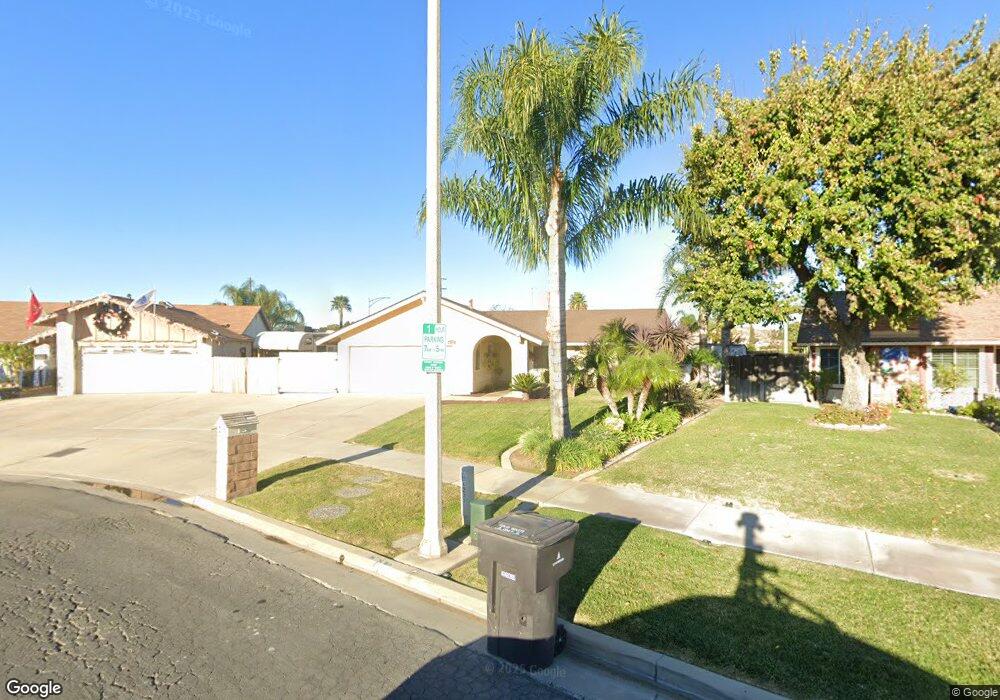
4233 Ferguson Ct Riverside, CA 92505
La Sierra NeighborhoodEstimated Value: $617,100 - $665,000
3
Beds
2
Baths
1,380
Sq Ft
$463/Sq Ft
Est. Value
About This Home
This home is located at 4233 Ferguson Ct, Riverside, CA 92505 and is currently estimated at $639,525, approximately $463 per square foot. 4233 Ferguson Ct is a home located in Riverside County with nearby schools including S. Christa Mcauliffe Elementary School, Ysmael Villegas Middle School, and La Sierra High School.
Ownership History
Date
Name
Owned For
Owner Type
Purchase Details
Closed on
May 29, 2007
Sold by
Martinez Ambrosio Jess and Martinez Connie L
Bought by
Martinez Ambrosio J and Martinez Connie L
Current Estimated Value
Purchase Details
Closed on
Apr 29, 1998
Sold by
Frank Sadler John and Faith Mary Faith
Bought by
Martinez Ambrosio Jess and Martinez Connie L
Home Financials for this Owner
Home Financials are based on the most recent Mortgage that was taken out on this home.
Original Mortgage
$101,483
Outstanding Balance
$19,777
Interest Rate
7.07%
Mortgage Type
FHA
Estimated Equity
$619,748
Purchase Details
Closed on
Sep 7, 1993
Sold by
Sadler John Frank and Sadler Mary Faith
Bought by
Sadler John Frank and Sadler Mary Faith
Home Financials for this Owner
Home Financials are based on the most recent Mortgage that was taken out on this home.
Original Mortgage
$117,420
Interest Rate
7.13%
Mortgage Type
FHA
Create a Home Valuation Report for This Property
The Home Valuation Report is an in-depth analysis detailing your home's value as well as a comparison with similar homes in the area
Home Values in the Area
Average Home Value in this Area
Purchase History
| Date | Buyer | Sale Price | Title Company |
|---|---|---|---|
| Martinez Ambrosio J | -- | None Available | |
| Martinez Ambrosio Jess | $102,000 | -- | |
| Sadler John Frank | -- | Chicago Title Company |
Source: Public Records
Mortgage History
| Date | Status | Borrower | Loan Amount |
|---|---|---|---|
| Open | Martinez Ambrosio Jess | $101,483 | |
| Previous Owner | Sadler John Frank | $117,420 |
Source: Public Records
Tax History
| Year | Tax Paid | Tax Assessment Tax Assessment Total Assessment is a certain percentage of the fair market value that is determined by local assessors to be the total taxable value of land and additions on the property. | Land | Improvement |
|---|---|---|---|---|
| 2025 | $2,349 | $192,530 | $63,848 | $128,682 |
| 2023 | $2,349 | $185,056 | $61,370 | $123,686 |
| 2022 | $2,175 | $181,428 | $60,167 | $121,261 |
| 2021 | $2,151 | $177,872 | $58,988 | $118,884 |
| 2020 | $2,117 | $176,049 | $58,384 | $117,665 |
| 2019 | $2,090 | $172,598 | $57,240 | $115,358 |
| 2018 | $2,061 | $169,215 | $56,119 | $113,096 |
| 2017 | $2,024 | $165,898 | $55,019 | $110,879 |
| 2016 | $1,991 | $162,646 | $53,941 | $108,705 |
| 2015 | $1,962 | $160,205 | $53,132 | $107,073 |
| 2014 | $1,955 | $157,070 | $52,093 | $104,977 |
Source: Public Records
Map
Nearby Homes
- 4201 Ferguson Ct
- 4247 Bravado
- 11230 Reliance Dr
- 11306 Trailstone Ct
- 11390 Parkfield Ct
- 11372 Riverpass Ct
- 11140 Bridgepoint Ct
- 11499 Bridgeway Dr
- 11369 Brookglen Ct
- 11141 Gardenhurst Ct
- 10920 Magnolia Ave
- 0 Rancho Corto Dr
- 4581 Geraty Ct
- 11552 Brookrun Ct
- 3874 Polk St Unit D
- 10649 Renner St
- 3666 Ada Ct
- 0 Polk St
- 10480 Bryan St
- 4878 Streambay Ct
- 4225 Ferguson Ct
- 4217 Ferguson Ct
- 4244 Ferguson Ct
- 4248 Vermilion Ct
- 4209 Ferguson Ct
- 4242 Ferguson Ct
- 4224 Ferguson Ct
- 4232 Ferguson Ct
- 4252 Vermilion Ct
- 4201 Sunrose Dr
- 4247 Vermilion Ct
- 11022 Arrowwood Dr
- 4251 Vermilion Ct
- 4214 Ferguson Ct
- 4246 Azure
- 4256 Vermilion Ct
- 4250 Azure
- 4203 Sunrose Dr
- 11111 Spaulding Rd
- 11135 Palladian
Your Personal Tour Guide
Ask me questions while you tour the home.