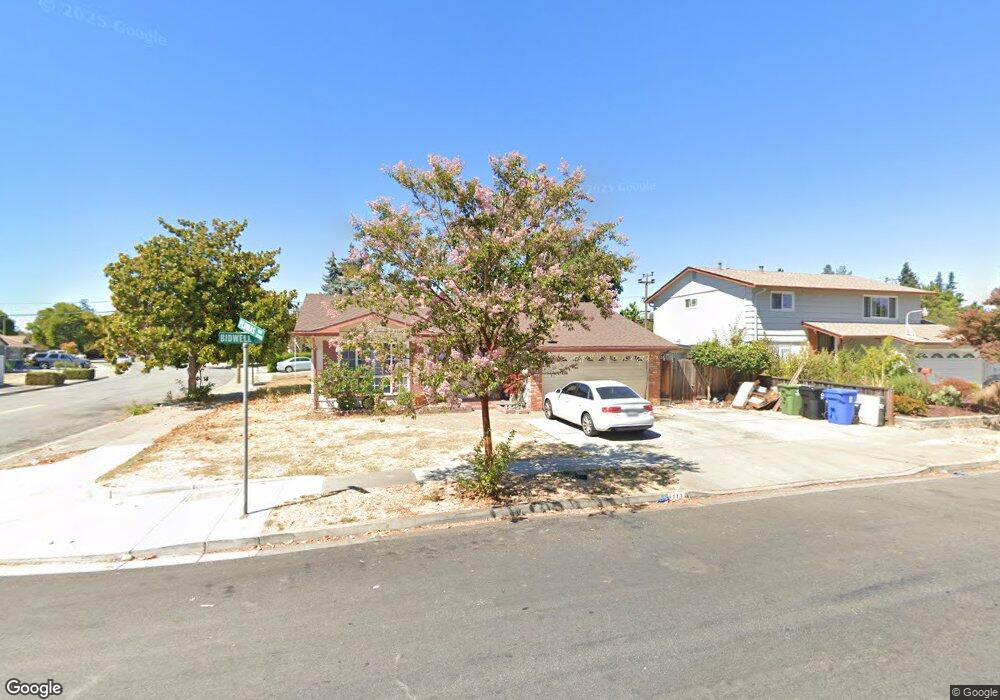
4235 Bidwell Dr Fremont, CA 94538
Sundale NeighborhoodEstimated Value: $1,378,000 - $1,426,000
4
Beds
2
Baths
1,427
Sq Ft
$980/Sq Ft
Est. Value
About This Home
This home is located at 4235 Bidwell Dr, Fremont, CA 94538 and is currently estimated at $1,398,774, approximately $980 per square foot. 4235 Bidwell Dr is a home located in Alameda County with nearby schools including Brier Elementary School, G.M. Walters Middle School, and John F. Kennedy High School.
Ownership History
Date
Name
Owned For
Owner Type
Purchase Details
Closed on
Feb 5, 2009
Sold by
Deutsche Bank National Trust Company
Bought by
Fang Paul
Current Estimated Value
Purchase Details
Closed on
Jul 3, 2008
Sold by
Karu Balvir and Kumar Rakesh
Bought by
Deutsche Bank National Trust Co and Long Beach Mortgage Loan Trust 2006-9
Purchase Details
Closed on
May 30, 2007
Sold by
Lal Purshotam
Bought by
Kaur Balvir and Kumar Rakesh
Purchase Details
Closed on
Sep 1, 2006
Sold by
Torres Larry C
Bought by
Kumar Rakesh and Kaur Balvir
Home Financials for this Owner
Home Financials are based on the most recent Mortgage that was taken out on this home.
Original Mortgage
$598,500
Interest Rate
8.82%
Mortgage Type
Balloon
Purchase Details
Closed on
Jun 2, 2000
Sold by
Torres Gerardo D and Torres Frances C
Bought by
Torres Larry C
Create a Home Valuation Report for This Property
The Home Valuation Report is an in-depth analysis detailing your home's value as well as a comparison with similar homes in the area
Home Values in the Area
Average Home Value in this Area
Purchase History
| Date | Buyer | Sale Price | Title Company |
|---|---|---|---|
| Fang Paul | $350,000 | Chicago Title Company | |
| Deutsche Bank National Trust Co | $388,000 | None Available | |
| Kaur Balvir | -- | None Available | |
| Kumar Rakesh | $665,000 | Ticor Title Co Of California | |
| Torres Larry C | -- | -- |
Source: Public Records
Mortgage History
| Date | Status | Borrower | Loan Amount |
|---|---|---|---|
| Previous Owner | Kumar Rakesh | $598,500 |
Source: Public Records
Tax History Compared to Growth
Tax History
| Year | Tax Paid | Tax Assessment Tax Assessment Total Assessment is a certain percentage of the fair market value that is determined by local assessors to be the total taxable value of land and additions on the property. | Land | Improvement |
|---|---|---|---|---|
| 2025 | $5,827 | $450,684 | $135,205 | $315,479 |
| 2024 | $5,827 | $441,850 | $132,555 | $309,295 |
| 2023 | $5,661 | $433,187 | $129,956 | $303,231 |
| 2022 | $5,573 | $424,696 | $127,409 | $297,287 |
| 2021 | $5,441 | $416,370 | $124,911 | $291,459 |
| 2020 | $5,408 | $412,103 | $123,631 | $288,472 |
| 2019 | $5,349 | $404,025 | $121,207 | $282,818 |
| 2018 | $5,244 | $396,104 | $118,831 | $277,273 |
| 2017 | $5,114 | $388,338 | $116,501 | $271,837 |
| 2016 | $5,020 | $380,725 | $114,217 | $266,508 |
| 2015 | $4,947 | $375,010 | $112,503 | $262,507 |
| 2014 | $4,857 | $367,667 | $110,300 | $257,367 |
Source: Public Records
Map
Nearby Homes
- 39753 Placer Way
- 39751 Bissy Common
- 39993 Fremont Blvd Unit 102
- 3909 Stevenson Blvd Unit 402
- 3695 Stevenson Blvd Unit E206
- 3848 Detjen St
- 4555 Stevenson Blvd
- 3583 Madison Common
- 4600 Nelson St
- 40116 Crockett St
- 3518 Madison Common
- 4453 Porter St
- 3454 Dayton Common
- 39530 Dorrington Ct
- 4737 Boone Dr
- 4421 Cahill St
- 3455 Gilman Common
- 39850 Sundale Dr
- 39134 Memorial St
- 39090 Presidio Way Unit 237
- 4223 Bidwell Dr
- 39762 Plumas Way
- 4247 Bidwell Dr
- 4211 Bidwell Dr
- 39761 Placer Way
- 39754 Plumas Way
- 4230 Bidwell Dr
- 4238 Bidwell Dr
- 39771 Plumas Way
- 4222 Bidwell Dr
- 4246 Bidwell Dr
- 4259 Bidwell Dr
- 39746 Plumas Way
- 39763 Plumas Way
- 4214 Bidwell Dr
- 39745 Placer Way
- 4254 Bidwell Dr
- 4197 Bidwell Dr
- 4206 Bidwell Dr
- 39738 Plumas Way