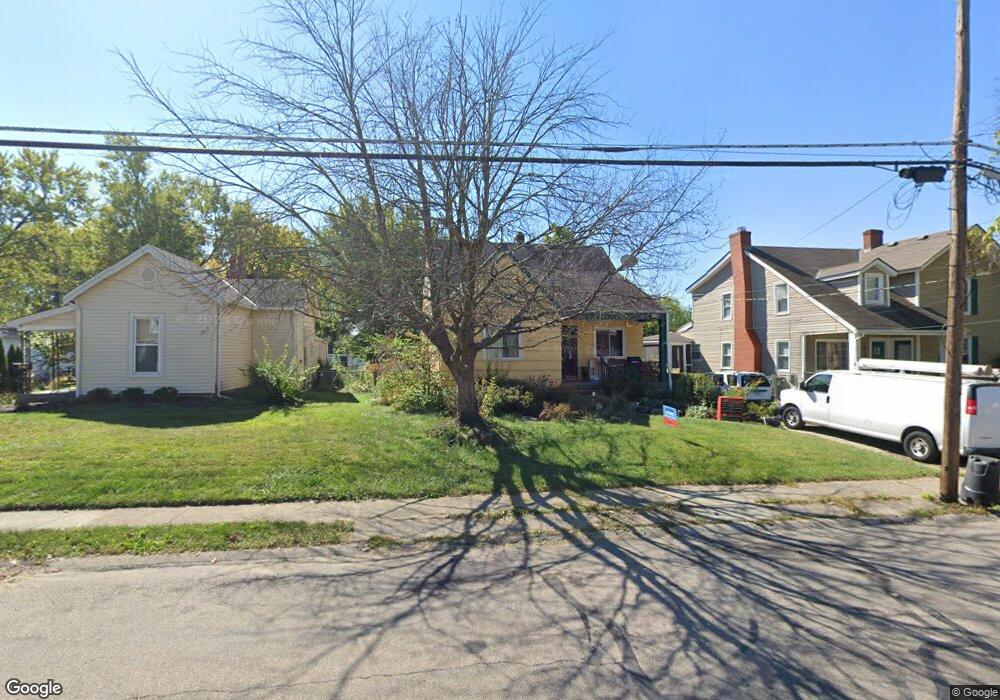
4237 Matson Ave Cincinnati, OH 45236
Estimated Value: $250,440 - $288,000
3
Beds
1
Bath
1,728
Sq Ft
$158/Sq Ft
Est. Value
About This Home
This home is located at 4237 Matson Ave, Cincinnati, OH 45236 and is currently estimated at $272,360, approximately $157 per square foot. 4237 Matson Ave is a home located in Hamilton County with nearby schools including Amity Elementary School, Deer Park Jr/Sr High School, and Ohr Torah Cincinnati.
Ownership History
Date
Name
Owned For
Owner Type
Purchase Details
Closed on
Jul 26, 2011
Sold by
Burnett Jennifer A
Bought by
Carr Michael A
Current Estimated Value
Home Financials for this Owner
Home Financials are based on the most recent Mortgage that was taken out on this home.
Original Mortgage
$63,000
Outstanding Balance
$42,912
Interest Rate
4.53%
Mortgage Type
New Conventional
Estimated Equity
$229,448
Purchase Details
Closed on
Jun 12, 2001
Sold by
Hendricks Ida Jean Tr
Bought by
Schmidt Robert Charles
Purchase Details
Closed on
Sep 3, 1998
Sold by
Hendricks Ida Jean
Bought by
Schmidt Robert Charles and Schmidt Paula Jean
Purchase Details
Closed on
May 1, 1996
Sold by
Hendricks Ida Jean
Bought by
Hendricks Ida Jean and Erwin Charles Schmidt Trust
Purchase Details
Closed on
Oct 17, 1994
Sold by
Schmidt Erwin Charles
Bought by
Hendricks Ida Jean and Schmidt Erwin Charles
Create a Home Valuation Report for This Property
The Home Valuation Report is an in-depth analysis detailing your home's value as well as a comparison with similar homes in the area
Home Values in the Area
Average Home Value in this Area
Purchase History
| Date | Buyer | Sale Price | Title Company |
|---|---|---|---|
| Carr Michael A | $90,000 | Attorney | |
| Schmidt Robert Charles | $68,000 | -- | |
| Schmidt Robert Charles | $68,000 | -- | |
| Hendricks Ida Jean | -- | -- | |
| Hendricks Ida Jean | -- | -- |
Source: Public Records
Mortgage History
| Date | Status | Borrower | Loan Amount |
|---|---|---|---|
| Open | Carr Michael A | $63,000 |
Source: Public Records
Tax History
| Year | Tax Paid | Tax Assessment Tax Assessment Total Assessment is a certain percentage of the fair market value that is determined by local assessors to be the total taxable value of land and additions on the property. | Land | Improvement |
|---|---|---|---|---|
| 2025 | $4,140 | $56,686 | $12,495 | $44,191 |
| 2024 | $3,466 | $56,686 | $12,495 | $44,191 |
| 2023 | $3,534 | $56,686 | $12,495 | $44,191 |
| 2022 | $3,703 | $45,784 | $10,175 | $35,609 |
| 2021 | $3,623 | $45,784 | $10,175 | $35,609 |
| 2020 | $3,353 | $45,784 | $10,175 | $35,609 |
| 2019 | $3,387 | $42,638 | $9,251 | $33,387 |
| 2018 | $3,473 | $42,638 | $9,251 | $33,387 |
| 2017 | $3,306 | $42,638 | $9,251 | $33,387 |
| 2016 | $3,064 | $39,022 | $9,226 | $29,796 |
| 2015 | $2,798 | $39,022 | $9,226 | $29,796 |
| 2014 | $2,799 | $39,022 | $9,226 | $29,796 |
| 2013 | $3,043 | $41,958 | $9,919 | $32,039 |
Source: Public Records
Map
Nearby Homes
- 4123 Hoffman Ave
- 4120 Hoffman Ave
- 4106 Orchard Ln
- 7905 Plainfield Rd
- 4050 O'Leary Ave
- 4208 Linden Ave
- 4009 Saint Johns Terrace
- 4300 Hegner Ave
- 7837 Moss Ct
- 8095 Camner Ave
- 13 Wentworth Ln
- 4305 Myrtle Ave
- 34 Wentworth Ln
- 7719 Dearborn Ave
- 7211 Maryland Ave
- 3982 Superior Ave
- 4390 Yakima Ct
- 4224 North Ave
- 7034 East Ave
- 4304 Kugler Mill Rd
- 4239 Matson Ave
- 4233 Matson Ave
- 4231 Matson Ave
- 4247 Matson Ave
- 4229 Matson Ave
- 4238 Matson Ave
- 4236 Matson Ave
- 4221 Matson Ave
- 4230 Matson Ave
- 4240 Matson Ave
- 4244 Matson Ave
- 4224 Matson Ave
- 4220 Matson Ave
- 4215 Matson Ave
- 4218 Matson Ave
- 4261 Matson Ave
- 4216 Matson Ave
- 4221 Schenck Ave
- 5314 Beech Ave
- 4219 Schenck Ave
Your Personal Tour Guide
Ask me questions while you tour the home.