Estimated Value: $202,000 - $281,000
3
Beds
2
Baths
2,065
Sq Ft
$122/Sq Ft
Est. Value
About This Home
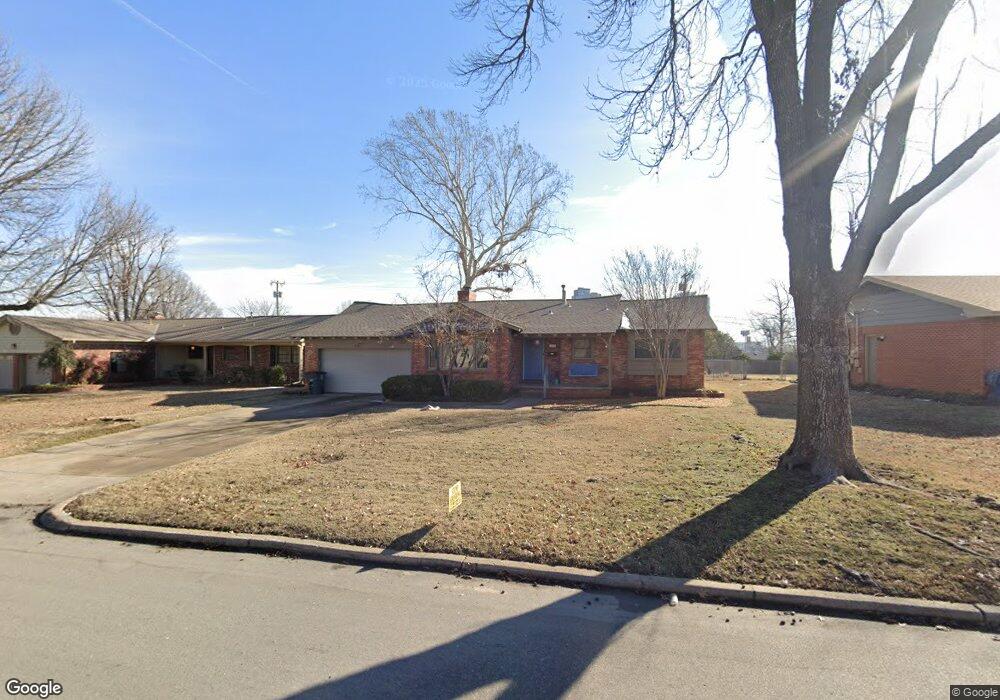
This home is located at 4237 S Darlington Ave, Tulsa, OK 74135 and is currently estimated at $252,893, approximately $122 per square foot. 4237 S Darlington Ave is a home located in Tulsa County with nearby schools including Patrick Henry Elementary School, Edison Preparatory School, and Thomas Edison Preparatory High School.
Ownership History
Date
Name
Owned For
Owner Type
Purchase Details
Closed on
Apr 9, 2015
Sold by
Paris And Paris Co
Bought by
Vandivort Thomas
Current Estimated Value
Home Financials for this Owner
Home Financials are based on the most recent Mortgage that was taken out on this home.
Original Mortgage
$140,000
Outstanding Balance
$107,392
Interest Rate
3.88%
Mortgage Type
VA
Estimated Equity
$145,501
Purchase Details
Closed on
Aug 27, 2009
Sold by
The Inocencsio Bargueiras Revocable Trus
Bought by
Paris & Paris Company
Home Financials for this Owner
Home Financials are based on the most recent Mortgage that was taken out on this home.
Original Mortgage
$101,320
Interest Rate
5.16%
Mortgage Type
Purchase Money Mortgage
Purchase Details
Closed on
Jun 6, 2007
Sold by
Bargueiras Lilia Rodriguez
Bought by
Bargueiras Ino
Purchase Details
Closed on
Mar 12, 1998
Sold by
Bargueiras Jose Luis
Bought by
Bargueiras Inocencio
Create a Home Valuation Report for This Property
The Home Valuation Report is an in-depth analysis detailing your home's value as well as a comparison with similar homes in the area
Purchase History
| Date | Buyer | Sale Price | Title Company |
|---|---|---|---|
| Vandivort Thomas | $140,000 | Guaranty Abstract Co | |
| Paris & Paris Company | $93,000 | Firstitle & Abstract Service | |
| Bargueiras Ino | -- | None Available | |
| Bargueiras Inocencio | -- | -- |
Source: Public Records
Mortgage History
| Date | Status | Borrower | Loan Amount |
|---|---|---|---|
| Open | Vandivort Thomas | $140,000 | |
| Previous Owner | Paris & Paris Company | $101,320 |
Source: Public Records
Tax History
| Year | Tax Paid | Tax Assessment Tax Assessment Total Assessment is a certain percentage of the fair market value that is determined by local assessors to be the total taxable value of land and additions on the property. | Land | Improvement |
|---|---|---|---|---|
| 2025 | $2,703 | $20,173 | $2,352 | $17,821 |
| 2024 | $2,322 | $19,213 | $2,918 | $16,295 |
| 2023 | $2,322 | $18,298 | $2,703 | $15,595 |
| 2022 | $2,323 | $17,427 | $3,299 | $14,128 |
| 2021 | $2,302 | $17,427 | $3,299 | $14,128 |
| 2020 | $2,270 | $17,427 | $3,299 | $14,128 |
| 2019 | $2,326 | $16,979 | $3,214 | $13,765 |
| 2018 | $2,221 | $16,170 | $3,061 | $13,109 |
| 2017 | $2,111 | $15,400 | $2,915 | $12,485 |
| 2016 | $2,067 | $15,400 | $2,915 | $12,485 |
| 2015 | $1,793 | $13,332 | $2,915 | $10,417 |
| 2014 | $1,776 | $13,332 | $2,915 | $10,417 |
Source: Public Records
Map
Nearby Homes
- 5518 E 46th St Unit 5518
- 5528 E 46th St Unit 9
- 3805 S Canton Ave
- 4029 S Vandalia Ave
- 4617 S Granite Ave
- 4803 E 46th St
- 4303 S Lakewood Ave
- 3743 S Braden Place
- 4704 E 46th St
- 3802 S Allegheny Ave
- 4664 S Winston Ave
- 4169 E 43rd St
- 5822 E 47th St
- 4814 E 37th St
- 4156 E 43rd St
- 4760 S Irvington Ave
- 4118 E 41st Place
- 4770 S Hudson Place
- 5825 E 36th St
- 4168 E 46th Place
- 4229 S Darlington Ave
- 4245 S Darlington Ave
- 4236 S Darlington Place
- 4230 S Darlington Place
- 4223 S Darlington Ave
- 4251 S Darlington Ave
- 4242 S Darlington Place
- 4224 S Darlington Place
- 4305 S Darlington Ave
- 4248 S Darlington Place
- 4218 S Darlington Place
- 4211 S Darlington Ave
- 4311 S Darlington Ave
- 4235 S Darlington Place
- 4229 S Darlington Place
- 5220 E 43rd St
- 4247 S Darlington Place
- 4212 S Darlington Place
- 4254 S Darlington Place
- 4223 S Darlington Place
Your Personal Tour Guide
Ask me questions while you tour the home.