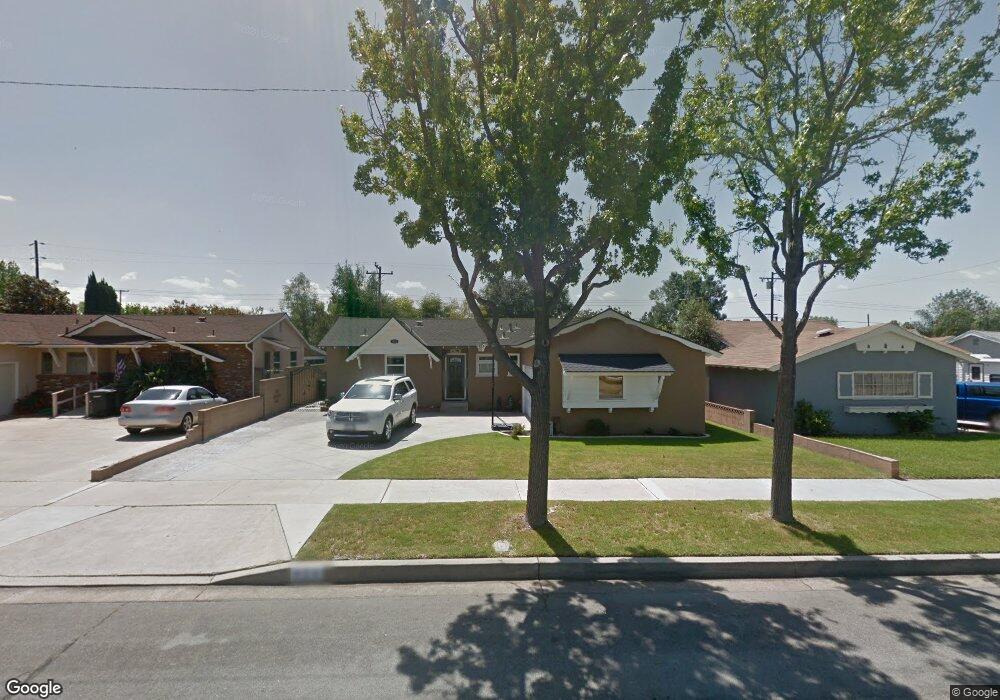
424 E Wilson Ave Orange, CA 92867
Estimated Value: $933,000 - $1,028,000
3
Beds
2
Baths
1,156
Sq Ft
$859/Sq Ft
Est. Value
About This Home
This home is located at 424 E Wilson Ave, Orange, CA 92867 and is currently estimated at $992,448, approximately $858 per square foot. 424 E Wilson Ave is a home located in Orange County with nearby schools including California iInspire Academy, Yorba Middle School, and Orange High School.
Ownership History
Date
Name
Owned For
Owner Type
Purchase Details
Closed on
Aug 9, 2005
Sold by
Littlejohn Matthew and Littlejohn Jennifer
Bought by
Stephens Michael W and Stephens Lisa M
Current Estimated Value
Home Financials for this Owner
Home Financials are based on the most recent Mortgage that was taken out on this home.
Original Mortgage
$385,000
Outstanding Balance
$198,463
Interest Rate
5.37%
Mortgage Type
Purchase Money Mortgage
Estimated Equity
$793,985
Purchase Details
Closed on
Jul 25, 2001
Sold by
Belcher Craig
Bought by
Belcher Lisanne R
Home Financials for this Owner
Home Financials are based on the most recent Mortgage that was taken out on this home.
Original Mortgage
$218,800
Interest Rate
7.09%
Purchase Details
Closed on
Jul 13, 2001
Sold by
Chapman John and Chapman Germaine
Bought by
Littlejohn Matthew and Littlejohn Jennifer
Home Financials for this Owner
Home Financials are based on the most recent Mortgage that was taken out on this home.
Original Mortgage
$218,800
Interest Rate
7.09%
Create a Home Valuation Report for This Property
The Home Valuation Report is an in-depth analysis detailing your home's value as well as a comparison with similar homes in the area
Home Values in the Area
Average Home Value in this Area
Purchase History
| Date | Buyer | Sale Price | Title Company |
|---|---|---|---|
| Stephens Michael W | $585,000 | First Southwestern Title Co | |
| Belcher Lisanne R | -- | Fidelity National Title Ins | |
| Littlejohn Matthew | $273,500 | Fidelity National Title Ins |
Source: Public Records
Mortgage History
| Date | Status | Borrower | Loan Amount |
|---|---|---|---|
| Open | Stephens Michael W | $385,000 | |
| Previous Owner | Littlejohn Matthew | $218,800 |
Source: Public Records
Tax History
| Year | Tax Paid | Tax Assessment Tax Assessment Total Assessment is a certain percentage of the fair market value that is determined by local assessors to be the total taxable value of land and additions on the property. | Land | Improvement |
|---|---|---|---|---|
| 2025 | $9,087 | $845,867 | $707,901 | $137,966 |
| 2024 | $9,087 | $829,282 | $694,021 | $135,261 |
| 2023 | $8,886 | $813,022 | $680,413 | $132,609 |
| 2022 | $7,976 | $727,260 | $613,719 | $113,541 |
| 2021 | $7,752 | $713,000 | $601,685 | $111,315 |
| 2020 | $6,920 | $633,216 | $521,901 | $111,315 |
| 2019 | $6,832 | $620,800 | $511,667 | $109,133 |
| 2018 | $6,423 | $580,000 | $511,667 | $68,333 |
| 2017 | $6,272 | $580,000 | $511,667 | $68,333 |
| 2016 | $5,823 | $537,000 | $468,667 | $68,333 |
| 2015 | $5,023 | $459,800 | $391,467 | $68,333 |
| 2014 | $5,007 | $459,800 | $391,467 | $68,333 |
Source: Public Records
Map
Nearby Homes
- 634 E Adams Ave
- 123 E Wilson Ave
- 994 N Cleveland St
- 201 W Collins Ave Unit 40
- 860 N Grand St
- 504 E Barkley Ave
- 1036 E Trenton Ave
- 622 E Lomita Ave
- 855 N Lemon St Unit 6
- 1011 E Chestnut Ave
- 840 N Lynn Dr
- 1758 N Widdows Way
- 1760 N Silverwood St
- 1540 E Trenton Ave Unit 79
- 1540 E Trenton Ave Unit 126
- 1540 E Trenton Ave Unit 95
- 1830 N Ridgewood St
- 934 E Rose Ave
- 910 E Glendale Ave
- 552 N Cambridge St
- 434 E Wilson Ave
- 414 E Wilson Ave
- 1135 N Center St
- 444 E Wilson Ave
- 404 E Wilson Ave
- 1136 N Shaffer St
- 1125 N Center St
- 435 E Wilson Ave
- 342 E Wilson Ave
- 1126 N Shaffer St
- 415 E Wilson Ave
- 1136 N Center St
- 445 E Wilson Ave
- 405 E Wilson Ave
- 1115 N Center St
- 1116 N Shaffer St
- 332 E Wilson Ave
- 343 E Wilson Ave
- 1126 N Center St
- 507 E Adams Ave
Your Personal Tour Guide
Ask me questions while you tour the home.