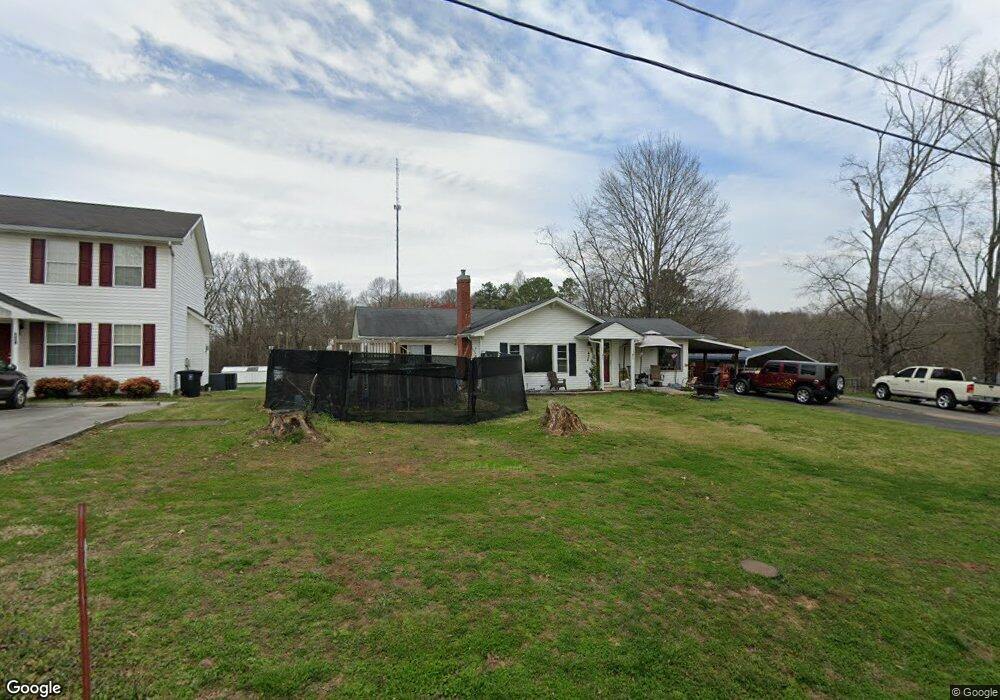
424 Eaves St Athens, TN 37303
Estimated Value: $173,700 - $224,000
2
Beds
1
Bath
1,282
Sq Ft
$153/Sq Ft
Est. Value
About This Home
This home is located at 424 Eaves St, Athens, TN 37303 and is currently estimated at $195,925, approximately $152 per square foot. 424 Eaves St is a home located in McMinn County with nearby schools including Athens City Middle School and Christ's Legacy Academy.
Ownership History
Date
Name
Owned For
Owner Type
Purchase Details
Closed on
Oct 2, 2015
Sold by
Tradewinds Investment Properties
Bought by
Tradewinds Investment Properties
Current Estimated Value
Purchase Details
Closed on
Nov 3, 2010
Sold by
Household Financial Center
Bought by
Mcconkey Jason
Purchase Details
Closed on
May 20, 2010
Sold by
Mobley Clyde
Bought by
Household Financial Center Inc
Purchase Details
Closed on
Jan 31, 2005
Sold by
Mobley Wanda F
Bought by
Mobley Clyde
Purchase Details
Closed on
Nov 26, 2002
Sold by
Spurlin W Dewayne and Spurlin Caroly
Bought by
Mobley Wanda F
Purchase Details
Closed on
Jul 22, 1996
Bought by
Spurlin W Dewayne W and Spurlin Carolyn S
Purchase Details
Closed on
May 13, 1991
Bought by
Carroll Henry T and Carroll Deleanor
Purchase Details
Closed on
Mar 27, 1990
Bought by
Rodgers Philip and Rodgers Holly
Purchase Details
Closed on
Jul 20, 1970
Bought by
Carroll Deleanor F
Create a Home Valuation Report for This Property
The Home Valuation Report is an in-depth analysis detailing your home's value as well as a comparison with similar homes in the area
Home Values in the Area
Average Home Value in this Area
Purchase History
| Date | Buyer | Sale Price | Title Company |
|---|---|---|---|
| Tradewinds Investment Properties | -- | -- | |
| Mcconkey Jason | $27,001 | -- | |
| Household Financial Center Inc | $55,786 | -- | |
| Mobley Clyde | $65,000 | -- | |
| Mobley Wanda F | $65,000 | -- | |
| Spurlin W Dewayne W | $60,000 | -- | |
| Carroll Henry T | -- | -- | |
| Rodgers Philip | -- | -- | |
| Carroll Deleanor F | -- | -- |
Source: Public Records
Tax History
| Year | Tax Paid | Tax Assessment Tax Assessment Total Assessment is a certain percentage of the fair market value that is determined by local assessors to be the total taxable value of land and additions on the property. | Land | Improvement |
|---|---|---|---|---|
| 2025 | $684 | $32,725 | $3,100 | $29,625 |
| 2024 | $684 | $32,725 | $3,100 | $29,625 |
| 2023 | $671 | $32,725 | $3,100 | $29,625 |
| 2022 | $595 | $20,525 | $3,100 | $17,425 |
| 2021 | $595 | $20,525 | $3,100 | $17,425 |
| 2020 | $578 | $20,525 | $3,100 | $17,425 |
| 2019 | $578 | $20,525 | $3,100 | $17,425 |
| 2018 | $542 | $20,525 | $3,100 | $17,425 |
| 2017 | $496 | $16,650 | $2,550 | $14,100 |
| 2016 | $496 | $16,650 | $2,550 | $14,100 |
| 2015 | -- | $16,650 | $2,550 | $14,100 |
| 2014 | $457 | $16,644 | $0 | $0 |
Source: Public Records
Map
Nearby Homes
- 1430 Hammerhill Rd
- 1618 Hogan St
- 361 Tennessee Ave Unit 307
- 306 Warren St
- 400 Warren St
- 109 Astrid St
- 111 Brown St
- 806 Towanda Trail
- 112 Peach St Unit st
- 605 Guille St
- 425 Cumberland Ave
- 111 Belle Way
- 153 Oak St
- 147 Oak St
- 141 Oak St
- 200 Pope St
- 1253 Towanda Trail
- 829 Northside Dr
- 1202 Georgia Ave
- 406 Taylor St
Your Personal Tour Guide
Ask me questions while you tour the home.