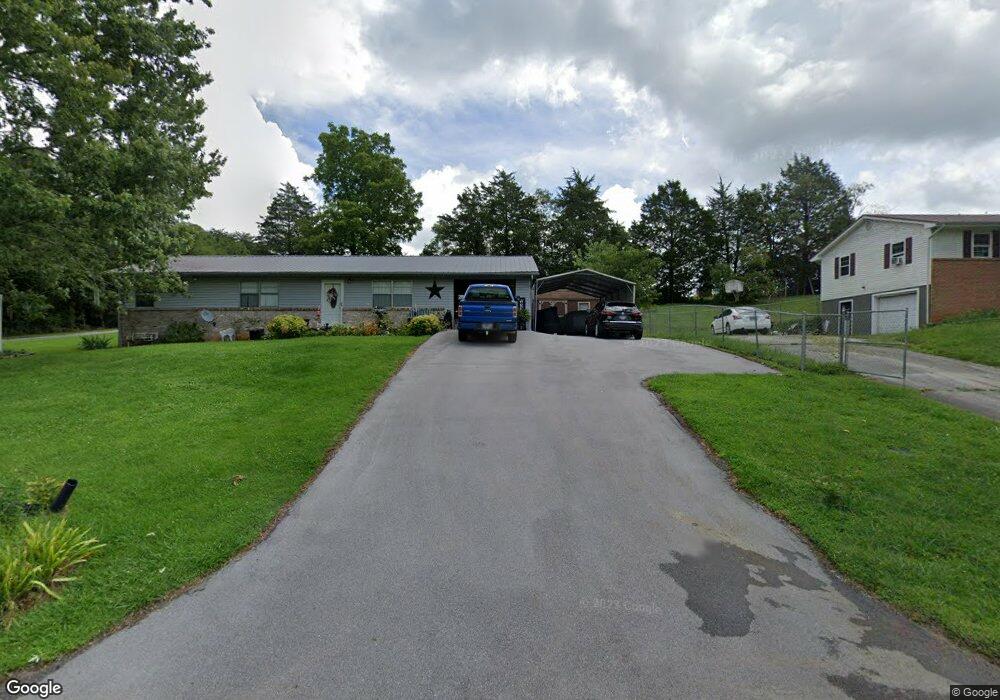
424 Hartshaw Dr Greeneville, TN 37743
Estimated Value: $210,000 - $304,000
3
Beds
2
Baths
1,842
Sq Ft
$137/Sq Ft
Est. Value
About This Home
This home is located at 424 Hartshaw Dr, Greeneville, TN 37743 and is currently estimated at $252,000, approximately $136 per square foot. 424 Hartshaw Dr is a home located in Greene County with nearby schools including Mosheim Elementary School, West Greene Middle Schools, and West Greene High School.
Ownership History
Date
Name
Owned For
Owner Type
Purchase Details
Closed on
Dec 2, 2022
Sold by
Gourley Alfred Rader
Bought by
Jenkins Roger D and Jenkins Sara
Current Estimated Value
Home Financials for this Owner
Home Financials are based on the most recent Mortgage that was taken out on this home.
Original Mortgage
$235,653
Outstanding Balance
$228,749
Interest Rate
7.08%
Mortgage Type
FHA
Estimated Equity
$23,251
Purchase Details
Closed on
Sep 26, 2017
Sold by
Hilton Jefferey Todd
Bought by
Brown Marvin and Brown Janet
Purchase Details
Closed on
Jul 26, 2017
Sold by
Payne Judy S
Bought by
Payne Judy S and Jones James C
Purchase Details
Closed on
Oct 22, 2009
Sold by
Vanderbilt Mtg
Bought by
Payne Judy L
Purchase Details
Closed on
Aug 28, 2009
Sold by
Adams Eric C
Bought by
Vanderbilt Mtg
Purchase Details
Closed on
Apr 21, 1988
Bought by
Bales George B Mary Ann
Create a Home Valuation Report for This Property
The Home Valuation Report is an in-depth analysis detailing your home's value as well as a comparison with similar homes in the area
Home Values in the Area
Average Home Value in this Area
Purchase History
| Date | Buyer | Sale Price | Title Company |
|---|---|---|---|
| Jenkins Roger D | $240,000 | Heritage Title & Closing Servi | |
| Brown Marvin | $20,000 | None Available | |
| Payne Judy S | -- | None Available | |
| Payne Judy L | $50,000 | -- | |
| Vanderbilt Mtg | $54,000 | -- | |
| Bales George B Mary Ann | $5,000 | -- |
Source: Public Records
Mortgage History
| Date | Status | Borrower | Loan Amount |
|---|---|---|---|
| Open | Jenkins Roger D | $235,653 |
Source: Public Records
Tax History Compared to Growth
Tax History
| Year | Tax Paid | Tax Assessment Tax Assessment Total Assessment is a certain percentage of the fair market value that is determined by local assessors to be the total taxable value of land and additions on the property. | Land | Improvement |
|---|---|---|---|---|
| 2024 | $1,131 | $68,550 | $10,600 | $57,950 |
| 2023 | $1,131 | $68,550 | $0 | $0 |
| 2022 | $744 | $36,950 | $7,825 | $29,125 |
| 2021 | $744 | $36,950 | $7,825 | $29,125 |
| 2020 | $744 | $36,950 | $7,825 | $29,125 |
| 2019 | $744 | $36,950 | $7,825 | $29,125 |
| 2018 | $744 | $36,950 | $7,825 | $29,125 |
| 2017 | $653 | $33,075 | $7,875 | $25,200 |
| 2016 | $620 | $33,075 | $7,875 | $25,200 |
| 2015 | $620 | $33,075 | $7,875 | $25,200 |
| 2014 | $620 | $33,075 | $7,875 | $25,200 |
Source: Public Records
Map
Nearby Homes
- 3905 Blue Springs Pkwy
- 20 Cherokee Blvd
- 95 Britton Ave
- 4356 Blue Springs Pkwy
- 640 Twin Barns Rd
- 427 Britton Ave
- 3340 Lonesome Pine Trail
- 40 Mount Pleasant Cir
- 00 W Andrew Johnson Hwy
- 5875 Blue Springs Pkwy
- 0 Old Knoxville Hwy
- Lot 2 Old Knoxville Hwy
- 00 Old Knoxville Hwy
- 210 Raders Sidetrack Rd
- 1470 Old Knoxville Hwy
- 000 Robert Harmon Rd
- 80 Doughtys Chapel Rd
- W Andrew Johnson Hwy
- 1140 Hartman Rd
- 9 Lonesome Pine Trail
- 406 Hartshaw Dr
- 398 Hartshaw Dr
- 374 Hartshaw Dr
- 438 Hartshaw Dr
- 350 Hartshaw Dr
- 409 Hartshaw Dr
- 435 Hartshaw Dr
- 368 Guinn Dr
- 338 Hartshaw Dr
- 375 Hartshaw Dr
- 349 Guinn Dr
- 348 Guinn Dr
- 497 Hartshaw Dr
- 310 Hartshaw Dr
- 331 Guinn Dr
- 322 Guinn Dr
- 292 Hartshaw Dr
- 323 Guinn Dr
- 541 Hartshaw Dr
- 541 Hartshaw Dr