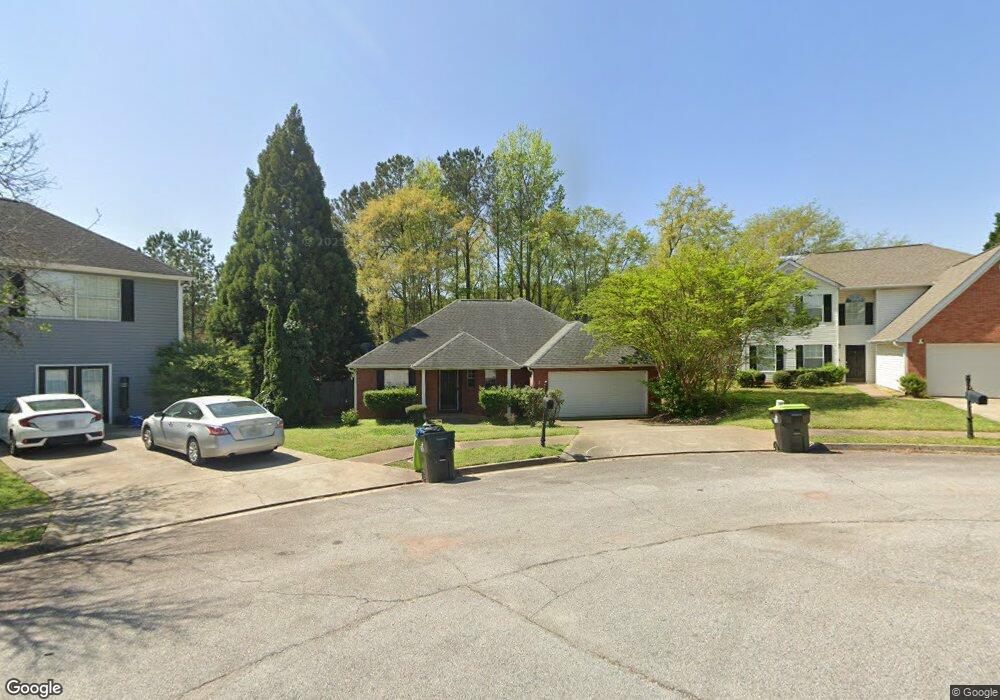
424 Trinkle Ct Unit 4 Stockbridge, GA 30281
Estimated Value: $261,000 - $273,000
3
Beds
2
Baths
1,545
Sq Ft
$172/Sq Ft
Est. Value
About This Home
This home is located at 424 Trinkle Ct Unit 4, Stockbridge, GA 30281 and is currently estimated at $266,299, approximately $172 per square foot. 424 Trinkle Ct Unit 4 is a home located in Henry County with nearby schools including Red Oak Elementary School, Dutchtown Middle School, and Dutchtown High School.
Ownership History
Date
Name
Owned For
Owner Type
Purchase Details
Closed on
Nov 28, 2005
Sold by
Allin Joshua B and Allin Amanda L
Bought by
Mandal Jayishnu
Current Estimated Value
Home Financials for this Owner
Home Financials are based on the most recent Mortgage that was taken out on this home.
Original Mortgage
$109,520
Outstanding Balance
$60,301
Interest Rate
6.12%
Mortgage Type
Stand Alone Second
Estimated Equity
$205,998
Purchase Details
Closed on
Sep 20, 2002
Sold by
Scott Beth
Bought by
Allin Joshua B
Home Financials for this Owner
Home Financials are based on the most recent Mortgage that was taken out on this home.
Original Mortgage
$128,397
Interest Rate
6.19%
Mortgage Type
FHA
Purchase Details
Closed on
Nov 25, 1998
Sold by
Chavez Walter Joseph
Bought by
Scott Beth
Home Financials for this Owner
Home Financials are based on the most recent Mortgage that was taken out on this home.
Original Mortgage
$108,500
Interest Rate
6.77%
Mortgage Type
New Conventional
Purchase Details
Closed on
Jul 3, 1996
Sold by
Jonesinc Herman
Bought by
Chavez Walter J
Create a Home Valuation Report for This Property
The Home Valuation Report is an in-depth analysis detailing your home's value as well as a comparison with similar homes in the area
Home Values in the Area
Average Home Value in this Area
Purchase History
| Date | Buyer | Sale Price | Title Company |
|---|---|---|---|
| Mandal Jayishnu | $136,900 | -- | |
| Allin Joshua B | $130,500 | -- | |
| Scott Beth | $111,900 | -- | |
| Scott Beth | $111,900 | -- | |
| Chavez Walter J | $109,900 | -- |
Source: Public Records
Mortgage History
| Date | Status | Borrower | Loan Amount |
|---|---|---|---|
| Open | Mandal Jayishnu | $109,520 | |
| Previous Owner | Allin Joshua B | $128,397 | |
| Previous Owner | Scott Beth | $108,500 | |
| Closed | Chavez Walter J | $0 |
Source: Public Records
Tax History
| Year | Tax Paid | Tax Assessment Tax Assessment Total Assessment is a certain percentage of the fair market value that is determined by local assessors to be the total taxable value of land and additions on the property. | Land | Improvement |
|---|---|---|---|---|
| 2025 | $4,308 | $102,280 | $14,000 | $88,280 |
| 2024 | $4,308 | $105,080 | $14,000 | $91,080 |
| 2023 | $4,681 | $108,800 | $10,000 | $98,800 |
| 2022 | $3,390 | $86,560 | $10,000 | $76,560 |
| 2021 | $2,582 | $65,480 | $8,000 | $57,480 |
| 2020 | $2,373 | $60,040 | $8,000 | $52,040 |
| 2019 | $2,193 | $55,360 | $8,000 | $47,360 |
| 2018 | $2,048 | $51,560 | $8,000 | $43,560 |
| 2016 | $1,565 | $46,040 | $8,000 | $38,040 |
| 2015 | $1,365 | $40,040 | $7,600 | $32,440 |
| 2014 | $1,083 | $32,680 | $4,800 | $27,880 |
Source: Public Records
Map
Nearby Homes
- 306 Nicole Terrace
- 564 Goldfinch Way
- 9 Cheyenne Dr
- 210 Summer Hill Cir
- 396 Avian Forest Dr
- 137 Dustin Dr
- 729 Old Stone Ct Unit 2
- 486 Village Cir
- 816 Lorraine Ln Unit 4
- 817 Lorraine Ln
- 469 Village Cir
- 44 Bay Cove Dr
- 503 Goldfinch Way
- 137 Arbor Cove Way
- 600 Dairy Dr
- 843 Tramore Dr
- 0 Tye St Unit 10634748
- 1545 Brangus Dr
- 100 Garden Walk
- 614 Tramore Ct
- 418 Trinkle Ct
- 423 Trinkle Ct
- 374 Tait Rd
- 412 Trinkle Ct Unit 4
- 372 Tait Rd
- 417 Trinkle Ct Unit IV
- 413 Trinkle Ct
- 413 Trinkle Ct Unit IV
- 409 Trinkle Ct
- 370 Tait Rd
- 370 Tait Rd Unit II
- 406 Trinkle Ct Unit 103
- 232 Eagle Way
- 405 Trinkle Ct Unit 4
- 371 Tait Rd
- 248 Eagle Way Unit 4
- 368 Tait Rd
- 507 Brookstone Way
- 513 Brookstone Way
- 513 Brookstone Way Unit IV