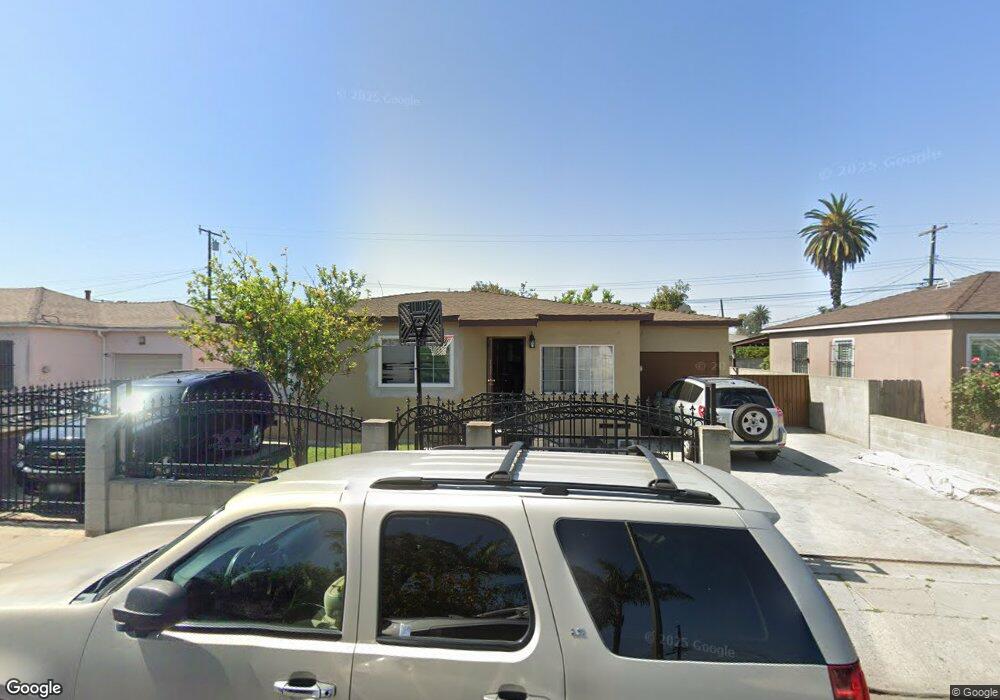
424 W Plum St Compton, CA 90222
Estimated Value: $547,482 - $613,000
3
Beds
1
Bath
952
Sq Ft
$596/Sq Ft
Est. Value
About This Home
This home is located at 424 W Plum St, Compton, CA 90222 and is currently estimated at $567,371, approximately $595 per square foot. 424 W Plum St is a home located in Los Angeles County with nearby schools including Rosecrans Elementary School, Benjamin O. Davis Middle School, and Compton High School.
Ownership History
Date
Name
Owned For
Owner Type
Purchase Details
Closed on
May 14, 2020
Sold by
Campos Jesus M and Campos Irma G
Bought by
Campos Jesus M and Campos Irma G
Current Estimated Value
Home Financials for this Owner
Home Financials are based on the most recent Mortgage that was taken out on this home.
Original Mortgage
$150,000
Outstanding Balance
$132,921
Interest Rate
3.3%
Mortgage Type
New Conventional
Estimated Equity
$434,450
Purchase Details
Closed on
Apr 23, 2014
Sold by
Campos J Jesus
Bought by
Campos M Jesus and Campos Irma G
Purchase Details
Closed on
Apr 10, 2000
Sold by
Morales Crispin
Bought by
Campos M Jesus and Campos Irma G
Home Financials for this Owner
Home Financials are based on the most recent Mortgage that was taken out on this home.
Original Mortgage
$106,621
Interest Rate
8.67%
Mortgage Type
FHA
Create a Home Valuation Report for This Property
The Home Valuation Report is an in-depth analysis detailing your home's value as well as a comparison with similar homes in the area
Home Values in the Area
Average Home Value in this Area
Purchase History
| Date | Buyer | Sale Price | Title Company |
|---|---|---|---|
| Campos Jesus M | -- | Chicago Title Company | |
| Campos M Jesus | -- | None Available | |
| Campos M Jesus | $107,500 | American Title Co |
Source: Public Records
Mortgage History
| Date | Status | Borrower | Loan Amount |
|---|---|---|---|
| Open | Campos Jesus M | $150,000 | |
| Previous Owner | Campos M Jesus | $106,621 |
Source: Public Records
Tax History
| Year | Tax Paid | Tax Assessment Tax Assessment Total Assessment is a certain percentage of the fair market value that is determined by local assessors to be the total taxable value of land and additions on the property. | Land | Improvement |
|---|---|---|---|---|
| 2025 | $3,476 | $165,199 | $99,735 | $65,464 |
| 2024 | $3,476 | $161,961 | $97,780 | $64,181 |
| 2023 | $3,424 | $158,786 | $95,863 | $62,923 |
| 2022 | $2,932 | $155,674 | $93,984 | $61,690 |
| 2021 | $2,953 | $152,623 | $92,142 | $60,481 |
| 2019 | $2,871 | $148,098 | $89,410 | $58,688 |
| 2018 | $2,745 | $145,195 | $87,657 | $57,538 |
| 2016 | $2,613 | $139,558 | $84,254 | $55,304 |
| 2015 | $2,504 | $137,463 | $82,989 | $54,474 |
| 2014 | $2,465 | $134,771 | $81,364 | $53,407 |
Source: Public Records
Map
Nearby Homes
- 521 W Cherry St
- 522 W Cherry St
- 348 W Peach St
- 363 W Spruce St
- 418 W Spruce St
- 905 N Hickory Ave
- 619 W Cherry St
- 629 W Plum St
- 315 W Cedar St
- 2062 E Hatchway St
- 701 W 139th St
- 124 W Rosecrans Ave
- 720 W Cherry St
- 2121 E Piru St
- 1608 N Grape Ave
- 720 W 137th St
- 2107 E Stockwell St
- 531 W Palmer St
- 806 W Spruce St
- 1111 N Mulberry St
Your Personal Tour Guide
Ask me questions while you tour the home.