424 Wilbar Cir Redlands, CA 92374
South Redlands NeighborhoodEstimated Value: $838,825 - $949,000
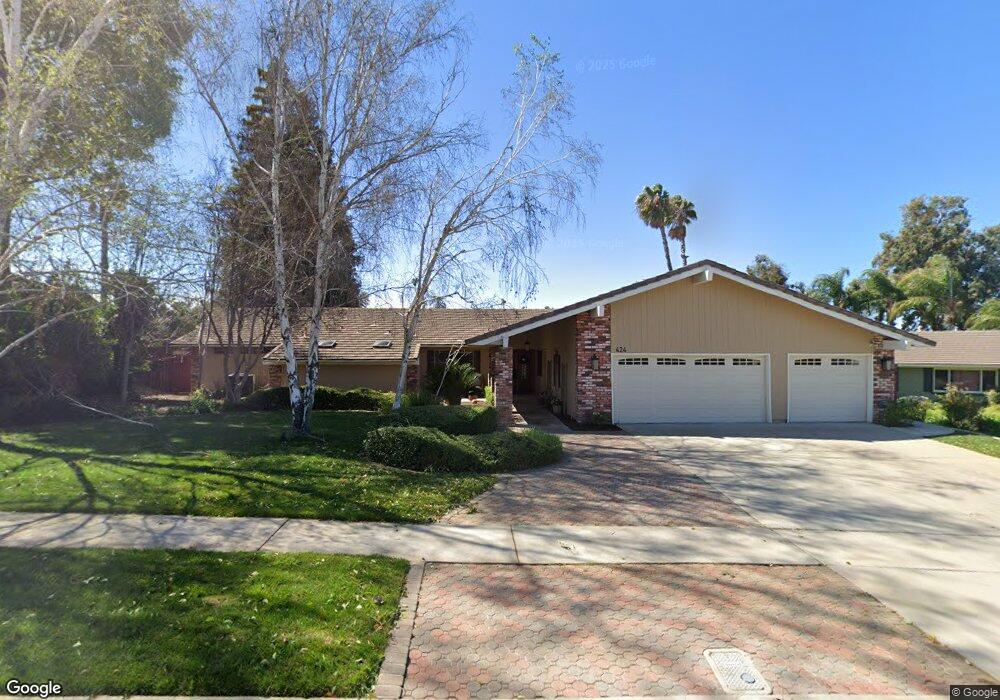
About This Home
This home is located at 424 Wilbar Cir, Redlands, CA 92374 and is currently estimated at $898,206, approximately $365 per square foot. 424 Wilbar Cir is a home located in San Bernardino County with nearby schools including Mariposa Elementary School, Moore Middle School, and Redlands East Valley High School.
Ownership History
We collect this data history from publicly available records. To have your information removed, we recommend requesting removal directly through your county’s website.
Purchase Details
Home Financials for this Owner
Home Financials are based on the most recent Mortgage that was taken out on this home.Purchase Details
Home Financials for this Owner
Home Financials are based on the most recent Mortgage that was taken out on this home.Purchase Details
Purchase Details
Home Financials for this Owner
Home Financials are based on the most recent Mortgage that was taken out on this home.Home Values in the Area
Average Home Value in this Area
Purchase History
We collect this data history from publicly available records. To have your information removed, we recommend requesting removal directly through your county’s website.
| Date | Buyer | Sale Price | Title Company |
|---|---|---|---|
| -- | Orange Coast Title Company | ||
| -- | Orange Coast Title Company | ||
| -- | None Available | ||
| $261,000 | Fidelity National Title |
Mortgage History
We collect this data history from publicly available records. To have your information removed, we recommend requesting removal directly through your county’s website.
| Date | Status | Borrower | Loan Amount |
|---|---|---|---|
| Open | $484,350 | ||
| Closed | $247,950 |
Tax History
We collect this data history from publicly available records. To have your information removed, we recommend requesting removal directly through your county’s website.
| Year | Tax Paid | Tax Assessment Tax Assessment Total Assessment is a certain percentage of the fair market value that is determined by local assessors to be the total taxable value of land and additions on the property. | Land | Improvement |
|---|---|---|---|---|
| 2025 | $5,255 | $429,042 | $100,288 | $328,754 |
| 2024 | $4,905 | $420,630 | $98,322 | $322,308 |
| 2023 | $4,897 | $412,382 | $96,394 | $315,988 |
| 2022 | $4,825 | $404,296 | $94,504 | $309,792 |
| 2021 | $4,911 | $396,369 | $92,651 | $303,718 |
| 2020 | $4,837 | $392,305 | $91,701 | $300,604 |
| 2019 | $4,478 | $359,614 | $89,905 | $269,709 |
| 2018 | $4,367 | $352,563 | $88,142 | $264,421 |
| 2017 | $4,330 | $345,650 | $86,414 | $259,236 |
| 2016 | $4,281 | $338,873 | $84,720 | $254,153 |
| 2015 | $4,250 | $333,782 | $83,447 | $250,335 |
| 2014 | $4,173 | $327,243 | $81,812 | $245,431 |
Map
- 1550 Marion Rd
- 210 Jesse Way
- 1426 5th Ave
- 1506 Crestview Rd
- 1458 Moore St
- 1452 Moore St
- 711 Afton Ct
- 1442 Moore St
- 1479 Moore St
- 123 S La Salle St
- 1454 E Highland Ave
- 1424 Moore St
- 1621 Arcata Dr
- 4 Dearborn Cir
- 1200 E Highland Ave Unit 406
- 1562 E Citrus Ave
- 1592 Christopher Ln
- 707 S Wabash Ave
- 1575 Christopher Ln
- 0 Wabash Ave Unit IV26099413
- 428 Wilbar Cir
- 420 Wilbar Cir
- 417 Wilbar Cir
- 416 Wilbar Cir
- 432 Wilbar Cir
- 425 Wilbar Cir
- 418 Silvertree Ln
- 413 Wilbar Cir
- 412 Wilbar Cir
- 500 Silvertree Ln
- 414 Silvertree Ln
- 409 Wilbar Cir
- 423 Silvertree Ln
- 408 Wilbar Cir
- 419 Silvertree Ln
- 410 Silvertree Ln
- 501 Silvertree Ln
- 415 Silvertree Ln
- 405 Wilbar Cir
- 404 Wilbar Cir
Ask me questions while you tour the home.