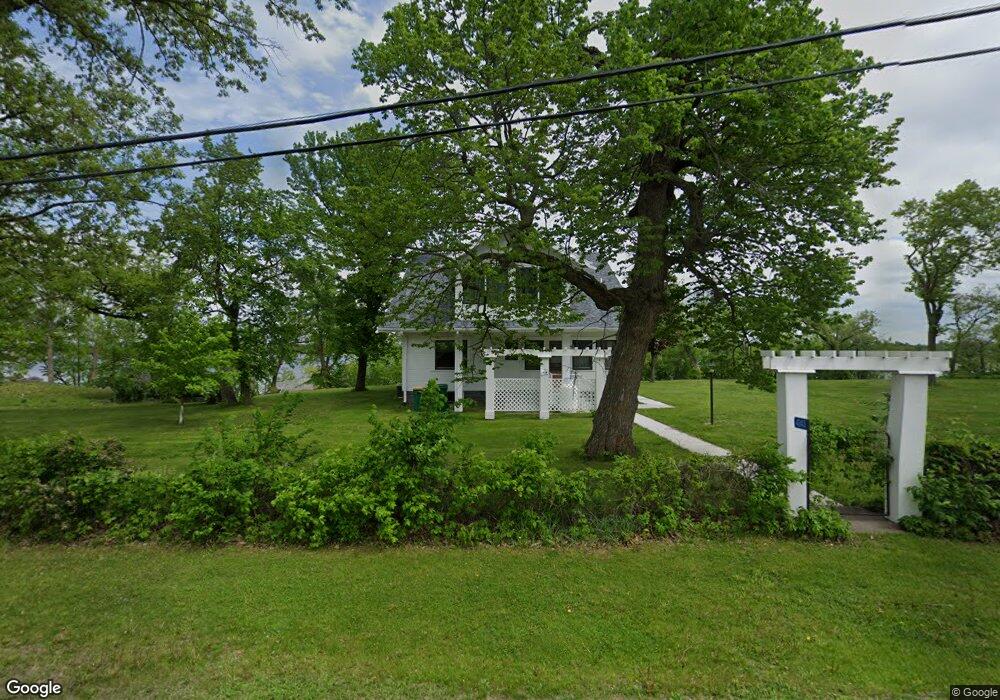
4243 County Road 11 NE Alexandria, MN 56308
Estimated Value: $897,000 - $1,320,000
--
Bed
--
Bath
1,960
Sq Ft
$568/Sq Ft
Est. Value
About This Home
This home is located at 4243 County Road 11 NE, Alexandria, MN 56308 and is currently estimated at $1,113,338, approximately $568 per square foot. 4243 County Road 11 NE is a home located in Douglas County with nearby schools including Voyager Elementary School, Discovery Middle School, and Alexandria Area High School.
Ownership History
Date
Name
Owned For
Owner Type
Purchase Details
Closed on
Nov 10, 2025
Sold by
Boerner Peter A
Bought by
John M Winkler Family Trust
Current Estimated Value
Purchase Details
Closed on
Oct 20, 2025
Sold by
Sara M Zimmerman Revocable Living Trust and Zimmerman Sara M
Bought by
John M Winkler Family Trust
Purchase Details
Closed on
May 25, 2010
Sold by
Zimmerman Sara M
Bought by
Boerner Peter A
Purchase Details
Closed on
Apr 20, 2008
Sold by
Stefanski Warren R and Stefanski Barbara D
Bought by
Winkler John M and Jameson Deborah L
Purchase Details
Closed on
Jun 29, 2007
Sold by
Winkler John M and Jameson Deborah L
Bought by
Zimmerman Sara M and Sara M Zimmerman Revocable Living Trust
Purchase Details
Closed on
Jun 20, 2007
Sold by
Winkler Arthur Dulany and Winkler Doris
Bought by
Winkler John M and Winkler John Mahan
Purchase Details
Closed on
Jun 15, 2007
Sold by
Thompson Dennis P
Bought by
Winlker John Mahan and Winlker John
Create a Home Valuation Report for This Property
The Home Valuation Report is an in-depth analysis detailing your home's value as well as a comparison with similar homes in the area
Home Values in the Area
Average Home Value in this Area
Purchase History
| Date | Buyer | Sale Price | Title Company |
|---|---|---|---|
| John M Winkler Family Trust | $15,000 | Integrity Title | |
| John M Winkler Family Trust | $600,000 | Integrity Title | |
| Boerner Peter A | -- | None Available | |
| Winkler John M | -- | None Available | |
| Zimmerman Sara M | -- | None Available | |
| Zimmerman Sara M | -- | None Available | |
| Winkler John M | $210,000 | None Available | |
| Winlker John Mahan | -- | None Available |
Source: Public Records
Tax History Compared to Growth
Tax History
| Year | Tax Paid | Tax Assessment Tax Assessment Total Assessment is a certain percentage of the fair market value that is determined by local assessors to be the total taxable value of land and additions on the property. | Land | Improvement |
|---|---|---|---|---|
| 2025 | $9,438 | $1,275,100 | $924,000 | $351,100 |
| 2024 | $9,438 | $1,235,000 | $890,400 | $344,600 |
| 2023 | $8,090 | $1,014,900 | $789,600 | $225,300 |
| 2022 | $7,482 | $931,100 | $638,400 | $292,700 |
| 2021 | $7,652 | $788,700 | $537,600 | $251,100 |
| 2020 | $7,624 | $752,800 | $512,400 | $240,400 |
| 2019 | $7,716 | $729,500 | $504,000 | $225,500 |
| 2018 | $7,634 | $701,700 | $487,200 | $214,500 |
| 2017 | $7,312 | $694,900 | $487,200 | $207,700 |
| 2016 | $7,738 | $669,397 | $472,584 | $196,813 |
| 2015 | $7,786 | $0 | $0 | $0 |
| 2014 | -- | $679,500 | $487,200 | $192,300 |
Source: Public Records
Map
Nearby Homes
- 3307 N Nokomis NE
- 105 Ross Garden NW
- 3877 Tolena Rd NE
- 3006 N Nokomis NE
- 3608 Tolena Rd NE
- 151 Bluffs Rd NW
- 4974 Interlachen Dr NE
- 2606 Sessions St NW
- 7826 unit 6 County Road 42 NE
- 7826 unit 8 County Road 42 NE
- 7826 unit 9 County Road 42 NE
- 7826 unit 3 County Road 42 NE
- 7826 unit 7 County Road 42 NE
- 2600 Le Homme Dieu View NE
- 3311 N Nokomis NE
- 6451 Stardust Ln NE
- 2807 Government Point Rd NE
- 1902 E Golf Course Rd NE Unit NE
- 205 Ashley Ln
- 4715 Dixie Ln SW
- 4209 County Road 11 NE
- 4210 County Road 11 NW
- 4209 4209 Co Rd 11
- 4209 Co Rd 11
- 4269 4269 Co Rd 11
- 4269 County Road 11 NE
- 4269 Co Rd 11
- 4191 County Road 11 NE
- 4335 County Road 11 NE
- 4183 County Road 11 NE
- 4381 County Road 11 NW
- 4381 County Road 11 NE
- 4381 4381 Cr 11
- 4381 Co Rd 11 NE
- 4175 County Road 11 NE
- 4393 County Road 11 NE
- 4167 County Road 11 NE
- 4440 County Road 11 NW
- 4158 County Road 11 NW
- 4135 County Road 11 NE