Estimated Value: $651,305 - $708,000
3
Beds
2
Baths
2,025
Sq Ft
$331/Sq Ft
Est. Value
About This Home
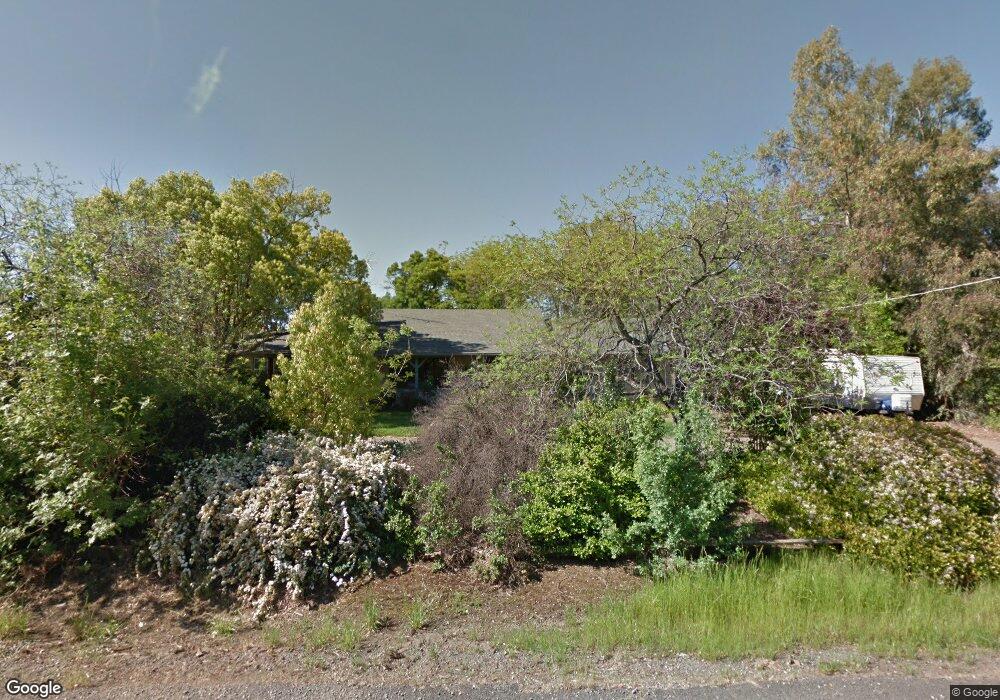
This home is located at 4245 Caballo Way, Chico, CA 95973 and is currently estimated at $670,826, approximately $331 per square foot. 4245 Caballo Way is a home located in Butte County with nearby schools including Shasta Elementary School, Bidwell Junior High School, and Pleasant Valley High School.
Ownership History
Date
Name
Owned For
Owner Type
Purchase Details
Closed on
Apr 25, 2021
Sold by
Noble Kenneth E and Noble Ellen M
Bought by
Noble Kenneth E and Noble Ellen M
Current Estimated Value
Home Financials for this Owner
Home Financials are based on the most recent Mortgage that was taken out on this home.
Original Mortgage
$250,000
Outstanding Balance
$188,916
Interest Rate
3%
Mortgage Type
New Conventional
Estimated Equity
$481,910
Purchase Details
Closed on
Apr 25, 2019
Sold by
Noble Kenneth E and Noble Ellen M
Bought by
Noble Kenneth E and Noble Ellen M
Purchase Details
Closed on
May 11, 2000
Sold by
Laurie Myron A and Laurie Darlene R
Bought by
Noble Kenneth E and Noble Ellen M
Home Financials for this Owner
Home Financials are based on the most recent Mortgage that was taken out on this home.
Original Mortgage
$180,600
Interest Rate
8.22%
Create a Home Valuation Report for This Property
The Home Valuation Report is an in-depth analysis detailing your home's value as well as a comparison with similar homes in the area
Purchase History
| Date | Buyer | Sale Price | Title Company |
|---|---|---|---|
| Noble Kenneth E | -- | Placer Title Company | |
| Noble Kenneth E | -- | None Available | |
| Noble Kenneth E | $226,000 | Bidwell Title & Escrow Co |
Source: Public Records
Mortgage History
| Date | Status | Borrower | Loan Amount |
|---|---|---|---|
| Open | Noble Kenneth E | $250,000 | |
| Closed | Noble Kenneth E | $180,600 |
Source: Public Records
Tax History
| Year | Tax Paid | Tax Assessment Tax Assessment Total Assessment is a certain percentage of the fair market value that is determined by local assessors to be the total taxable value of land and additions on the property. | Land | Improvement |
|---|---|---|---|---|
| 2025 | $4,188 | $392,440 | $115,258 | $277,182 |
| 2024 | $4,188 | $384,747 | $112,999 | $271,748 |
| 2023 | $4,135 | $377,204 | $110,784 | $266,420 |
| 2022 | $4,066 | $369,809 | $108,612 | $261,197 |
| 2021 | $3,988 | $362,559 | $106,483 | $256,076 |
| 2020 | $3,976 | $358,843 | $105,392 | $253,451 |
| 2019 | $3,903 | $351,808 | $103,326 | $248,482 |
| 2018 | $3,909 | $344,910 | $101,300 | $243,610 |
| 2017 | $3,830 | $338,148 | $99,314 | $238,834 |
| 2016 | $3,496 | $331,518 | $97,367 | $234,151 |
| 2015 | $3,496 | $326,539 | $95,905 | $230,634 |
| 2014 | $3,411 | $320,144 | $94,027 | $226,117 |
Source: Public Records
Map
Nearby Homes
- 375 Bainbridge Place
- 306 Bellamy Terrace
- 3555 Via Medio Unit 175
- 3548 Via Medio
- 3541 Vía Medio
- 0 Kelly W Unit Cana Pine Creek Road
- 3424 Hackamore Ln
- 3269 Rockin M Dr
- 3156 Esplanade Unit 293
- 3156 Esplanade Unit 228
- 3156 Esplanade Unit 300
- 3156 Esplanade Unit 207
- 0 Garner Ln
- 3484 Peerless Ln
- 4117 Nord Hwy
- 372 Weymouth Way
- 862 Pico Place
- 455 Cimarron Dr
- 878 Pico Place
- 3465 Shaker Ln
- 4269 Caballo Way
- 4254 Caballo Way
- 4242 Caballo Way
- 4224 Caballo Way
- 4219 Caballo Way
- 4266 Caballo Way
- 4283 Caballo Way
- 4276 Caballo Way
- 4208 Caballo Way
- 4293 Caballo Way
- 4362 Caballo Way
- 4312 Caballo Way
- 4380 Caballo Way
- 3747 Hicks Ln
- 4396 Caballo Way
- 4408 Caballo Way
- 4332 Caballo Way
- 4301 Caballo Way
- 4383 Caballo Way
- 4367 Caballo Way
Your Personal Tour Guide
Ask me questions while you tour the home.