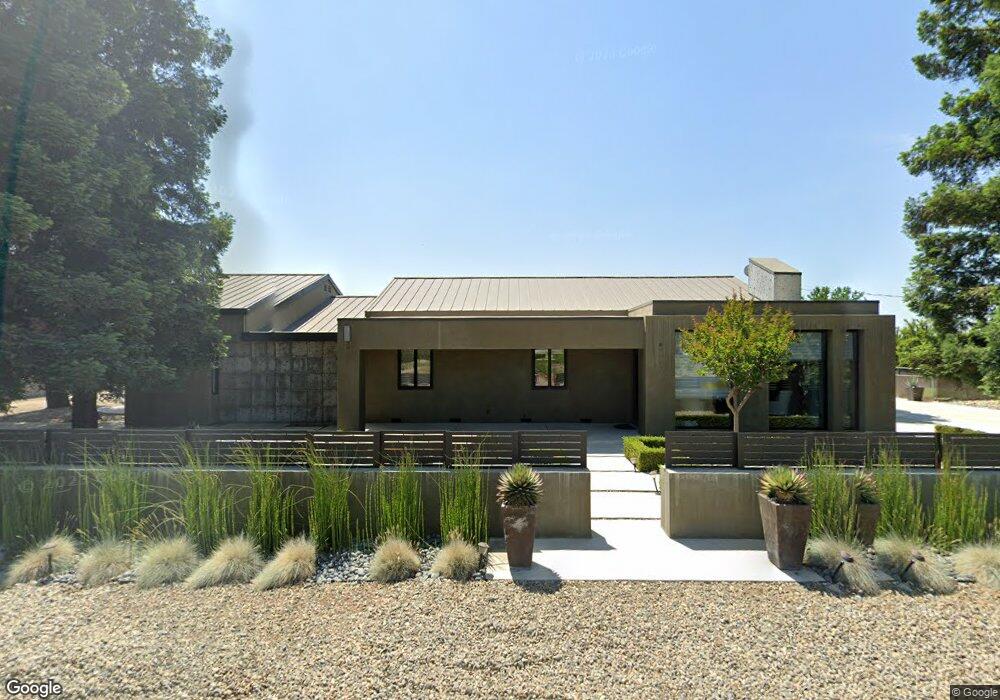
4249 S Gratton Rd Denair, CA 95316
Estimated Value: $850,000 - $1,050,000
3
Beds
1
Bath
1,616
Sq Ft
$602/Sq Ft
Est. Value
About This Home
This home is located at 4249 S Gratton Rd, Denair, CA 95316 and is currently estimated at $973,373, approximately $602 per square foot. 4249 S Gratton Rd is a home located in Stanislaus County.
Ownership History
Date
Name
Owned For
Owner Type
Purchase Details
Closed on
Oct 16, 2025
Sold by
Ochoa Edward M and Ochoa Anabel
Bought by
Turlock Irrigation District
Current Estimated Value
Purchase Details
Closed on
Jan 13, 2023
Sold by
Ochoa Edward M and Ochoa Anabel
Bought by
Ochoa 2023 Trust and Ochoa
Purchase Details
Closed on
May 4, 2006
Sold by
The Marion O Howard Family Partnership
Bought by
Ochoa Edward M and Ochoa Anabel
Home Financials for this Owner
Home Financials are based on the most recent Mortgage that was taken out on this home.
Original Mortgage
$300,000
Interest Rate
6.55%
Mortgage Type
Fannie Mae Freddie Mac
Purchase Details
Closed on
Aug 29, 1995
Sold by
Howard Marion Opal
Bought by
Marion O Howard Family Ltd Partnership
Purchase Details
Closed on
Jun 21, 1995
Sold by
Howard Marion O
Bought by
Turner Mary E and Turner Howard T
Create a Home Valuation Report for This Property
The Home Valuation Report is an in-depth analysis detailing your home's value as well as a comparison with similar homes in the area
Purchase History
| Date | Buyer | Sale Price | Title Company |
|---|---|---|---|
| Turlock Irrigation District | -- | -- | |
| Ochoa 2023 Trust | -- | None Listed On Document | |
| Ochoa Edward M | $850,000 | Fidelity Natl Title Co Of Ca | |
| Marion O Howard Family Ltd Partnership | -- | -- | |
| Marion O Howard Family Ltd Partnership | -- | -- | |
| Turner Mary E | -- | -- | |
| Howard Marion O | -- | -- |
Source: Public Records
Mortgage History
| Date | Status | Borrower | Loan Amount |
|---|---|---|---|
| Previous Owner | Ochoa Edward M | $300,000 |
Source: Public Records
Tax History
| Year | Tax Paid | Tax Assessment Tax Assessment Total Assessment is a certain percentage of the fair market value that is determined by local assessors to be the total taxable value of land and additions on the property. | Land | Improvement |
|---|---|---|---|---|
| 2025 | $7,176 | $692,406 | $403,503 | $288,903 |
| 2024 | $6,661 | $619,633 | $398,825 | $220,808 |
| 2023 | $6,616 | $620,137 | $396,124 | $224,013 |
| 2022 | $6,739 | $629,478 | $394,649 | $234,829 |
| 2021 | $6,730 | $592,067 | $332,712 | $259,355 |
| 2020 | $6,579 | $581,770 | $308,723 | $273,047 |
| 2019 | $6,595 | $580,051 | $301,915 | $278,136 |
| 2018 | $4,526 | $383,693 | $242,472 | $141,221 |
| 2017 | $4,127 | $335,228 | $204,872 | $130,356 |
| 2016 | $4,339 | $364,217 | $209,517 | $154,700 |
| 2015 | $3,567 | $303,719 | $151,920 | $151,799 |
| 2014 | $3,258 | $265,057 | $121,875 | $143,182 |
Source: Public Records
Map
Nearby Homes
- 4621 Swanson Rd
- 4541 N Gratton Rd
- 4317 Roy Dan Ln
- 4301 Windgate Dr
- 4117 Windgate Dr
- 4201 Chalmer Ct
- 4215 Riopel Ave
- 1342 Hickman Rd
- 4124 N Gratton Rd
- 13571 Wimer
- 4105 Chica Ave
- 5331 Geer Rd
- 3825 San Joaquin Ave
- 0 Country Walk Ln Unit 226026008
- 966 Elma St
- 3416 N Gratton Rd
- 4640 Colorado Ave
- 3450 Perch Dr
- 770 Merriam Rd
- 4184 Ivory Ln
- 4126 S Gratton Rd
- 4119 S Gratton Rd
- 4124 S Gratton Rd
- 4319 N Gratton Rd
- 4000 S Gratton Rd
- 11100 E Service Rd
- 11067 Doerksen Rd
- 4448 S Gratton Rd
- 3966 S Gratton Rd
- 3961 S Gratton Rd
- 11177 Doerksen Rd
- 11107 Doerksen Rd
- 11101 E Service Rd
- 10737 E Service Rd
- 10631 Doerksen Rd
- 4607 S Gratton Rd
- 10673 E Service Rd
- 11207 E Service Rd
- 11200 Doerksen Rd
- 11225 Doerksen Rd
Your Personal Tour Guide
Ask me questions while you tour the home.