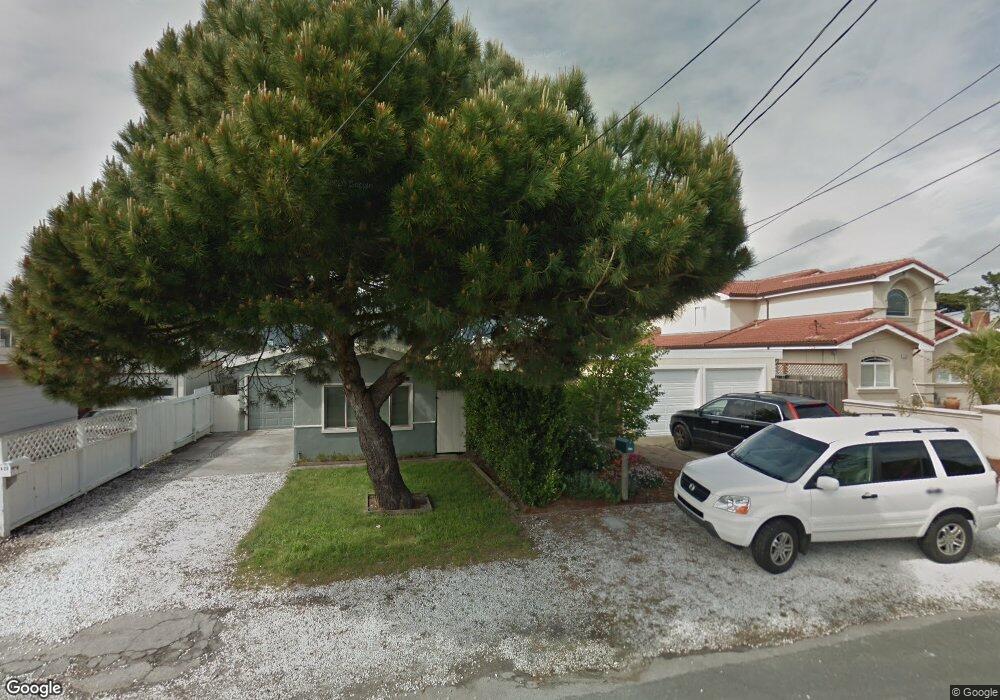
425 Filbert St Half Moon Bay, CA 94019
Estimated Value: $1,303,000 - $1,469,377
3
Beds
2
Baths
1,560
Sq Ft
$906/Sq Ft
Est. Value
About This Home
This home is located at 425 Filbert St, Half Moon Bay, CA 94019 and is currently estimated at $1,413,344, approximately $905 per square foot. 425 Filbert St is a home located in San Mateo County with nearby schools including Alvin S. Hatch Elementary School, Manuel F. Cunha Intermediate School, and Half Moon Bay High School.
Ownership History
Date
Name
Owned For
Owner Type
Purchase Details
Closed on
Jul 20, 2013
Sold by
Hannegan Bryan J and Hannegan Michele M
Bought by
Hannegan Bryan J and Hannegan Michele M
Current Estimated Value
Home Financials for this Owner
Home Financials are based on the most recent Mortgage that was taken out on this home.
Original Mortgage
$625,500
Outstanding Balance
$454,831
Interest Rate
3.92%
Mortgage Type
New Conventional
Estimated Equity
$958,513
Purchase Details
Closed on
Jun 3, 2009
Sold by
Hannegan Bryan J and Hannegan Michele M
Bought by
Hannegan Bryan J and Hannegan Michele M
Purchase Details
Closed on
Dec 14, 2006
Sold by
Weiss Alison and Weiss Ronald
Bought by
Hannegan Bryan J and Hannegan Michele M
Home Financials for this Owner
Home Financials are based on the most recent Mortgage that was taken out on this home.
Original Mortgage
$146,800
Interest Rate
6.16%
Mortgage Type
Stand Alone Second
Create a Home Valuation Report for This Property
The Home Valuation Report is an in-depth analysis detailing your home's value as well as a comparison with similar homes in the area
Home Values in the Area
Average Home Value in this Area
Purchase History
| Date | Buyer | Sale Price | Title Company |
|---|---|---|---|
| Hannegan Bryan J | -- | Nextitle | |
| Hannegan Bryan J | -- | Nextitle | |
| Hannegan Bryan J | -- | None Available | |
| Hannegan Bryan J | $734,000 | North American Title Company |
Source: Public Records
Mortgage History
| Date | Status | Borrower | Loan Amount |
|---|---|---|---|
| Open | Hannegan Bryan J | $625,500 | |
| Closed | Hannegan Bryan J | $146,800 | |
| Closed | Hannegan Bryan J | $587,200 |
Source: Public Records
Tax History
| Year | Tax Paid | Tax Assessment Tax Assessment Total Assessment is a certain percentage of the fair market value that is determined by local assessors to be the total taxable value of land and additions on the property. | Land | Improvement |
|---|---|---|---|---|
| 2025 | $12,155 | $983,392 | $491,696 | $491,696 |
| 2023 | $12,155 | $945,206 | $472,603 | $472,603 |
| 2022 | $11,394 | $926,674 | $463,337 | $463,337 |
| 2021 | $11,084 | $908,504 | $454,252 | $454,252 |
| 2020 | $10,975 | $899,190 | $449,595 | $449,595 |
| 2019 | $10,759 | $881,560 | $440,780 | $440,780 |
| 2018 | $10,092 | $864,276 | $432,138 | $432,138 |
| 2017 | $9,991 | $847,330 | $423,665 | $423,665 |
| 2016 | $9,906 | $830,716 | $415,358 | $415,358 |
| 2015 | $8,728 | $725,000 | $362,500 | $362,500 |
| 2014 | $7,441 | $600,000 | $300,000 | $300,000 |
Source: Public Records
Map
Nearby Homes
- 345 Granelli Ave
- 132 Amesport Landing
- SW Cor 2nd Magnolia St
- 0 Magnolia Unit ML81987516
- 229 Garcia Ave
- 533 Alsace Loraine Ave
- 460 Pine Ave Unit 46
- 430 Pine Ave
- 470 Willow Ave
- 466 Willow Ave
- 525 Creekside Ct Unit LOT 2
- 535 Creekside Ct Unit LOT 3
- 577 Creekside Ct
- 220 Main St
- 414 Belleville Blvd
- 71 Patrick Way
- 411 Belleville Blvd
- 0 Van Ness Ave Unit ML82035609
- 606 Highland Ave
- 200 Dolores Ave
- 423 Filbert St
- 435 Filbert St
- 419 Filbert St
- 415 Filbert St
- 443 Filbert St
- 432 Myrtle St
- 411 Filbert St Unit 413A
- 420 Myrtle St
- 440 Myrtle St
- 412 Myrtle St
- 455 Filbert St
- 401 Filbert St
- 432 Filbert St
- 424 Filbert St
- 448 Myrtle St
- 440 Filbert St
- 404 Myrtle St
- 459 Filbert St
- 416 Filbert St
- 468 Myrtle St
Your Personal Tour Guide
Ask me questions while you tour the home.