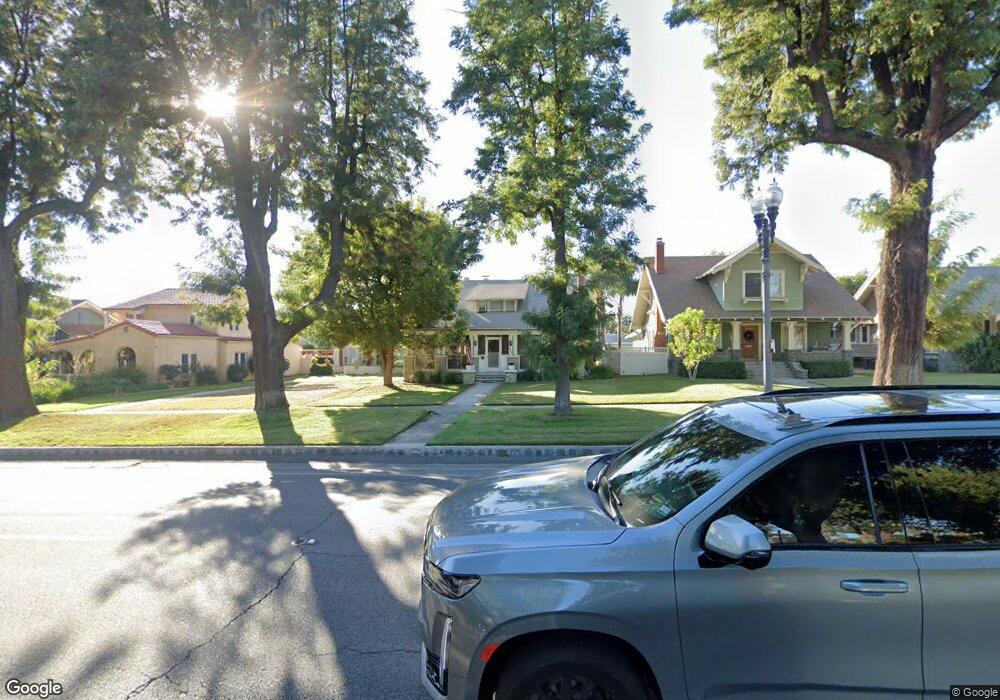
425 N Euclid Ave Upland, CA 91786
Estimated Value: $755,000 - $859,000
4
Beds
3
Baths
2,622
Sq Ft
$306/Sq Ft
Est. Value
About This Home
This home is located at 425 N Euclid Ave, Upland, CA 91786 and is currently estimated at $801,984, approximately $305 per square foot. 425 N Euclid Ave is a home located in San Bernardino County with nearby schools including Baldy View Elementary School, Upland Junior High School, and Upland High School.
Ownership History
Date
Name
Owned For
Owner Type
Purchase Details
Closed on
Feb 27, 2020
Sold by
Short Georgia M
Bought by
Short Georgia Meyers
Current Estimated Value
Purchase Details
Closed on
May 28, 2009
Sold by
Short Farris Hyatt
Bought by
Short Farris H and Short Georgia M
Home Financials for this Owner
Home Financials are based on the most recent Mortgage that was taken out on this home.
Original Mortgage
$165,800
Interest Rate
4.8%
Mortgage Type
Stand Alone Refi Refinance Of Original Loan
Create a Home Valuation Report for This Property
The Home Valuation Report is an in-depth analysis detailing your home's value as well as a comparison with similar homes in the area
Home Values in the Area
Average Home Value in this Area
Purchase History
| Date | Buyer | Sale Price | Title Company |
|---|---|---|---|
| Short Georgia Meyers | -- | None Available | |
| Short Farris H | -- | Lawyers Title La |
Source: Public Records
Mortgage History
| Date | Status | Borrower | Loan Amount |
|---|---|---|---|
| Closed | Short Farris H | $165,800 |
Source: Public Records
Tax History Compared to Growth
Tax History
| Year | Tax Paid | Tax Assessment Tax Assessment Total Assessment is a certain percentage of the fair market value that is determined by local assessors to be the total taxable value of land and additions on the property. | Land | Improvement |
|---|---|---|---|---|
| 2025 | $3,210 | $296,854 | $56,295 | $240,559 |
| 2024 | $3,210 | $291,033 | $55,191 | $235,842 |
| 2023 | $3,160 | $285,327 | $54,109 | $231,218 |
| 2022 | $3,090 | $279,732 | $53,048 | $226,684 |
| 2021 | $3,082 | $274,247 | $52,008 | $222,239 |
| 2020 | $2,998 | $271,435 | $51,475 | $219,960 |
| 2019 | $2,987 | $266,113 | $50,466 | $215,647 |
| 2018 | $2,915 | $260,895 | $49,476 | $211,419 |
| 2017 | $2,829 | $255,780 | $48,506 | $207,274 |
| 2016 | $2,636 | $250,765 | $47,555 | $203,210 |
| 2015 | $2,575 | $246,999 | $46,841 | $200,158 |
| 2014 | $2,507 | $242,160 | $45,923 | $196,237 |
Source: Public Records
Map
Nearby Homes
- Plan 3 at Towns on First - Towns On First
- Plan 4 at Towns on First - Towns On First
- 119 N 1st Ave
- 435 W 9th St Unit F5
- 435 W 9th St Unit B3
- 691 N 3rd Ave
- 537 W 9th St
- 164 Euclid Place
- 855 N Palm Ave
- 511 D St
- 524 E Arrow Hwy
- 173 W 8th St
- 556 D St
- 910 N Redding Way Unit F
- 173 Elizabeth Ln
- 144 Dorsett Ave
- 110 Royal Way
- 928 N Redding Way Unit D
- 152 Dorsett Ave
- 228 Greentree Rd
- 443 N Euclid Ave
- 401 N Euclid Ave
- 391 N Euclid Ave
- 461 N Euclid Ave
- 379 N Euclid Ave
- 477 N Euclid Ave
- 418 N Laurel Ave
- 436 N Laurel Ave
- 400 N Laurel Ave
- 62 W Arrow Hwy
- 359 N Euclid Ave
- 14 W Arrow Hwy
- 382 N Laurel Ave
- 78 W Arrow Hwy
- 368 N Laurel Ave
- 341 N Euclid Ave
- 92 W Arrow Hwy
- 348 N Laurel Ave
- 323 N Euclid Ave
- 509 N Euclid Ave