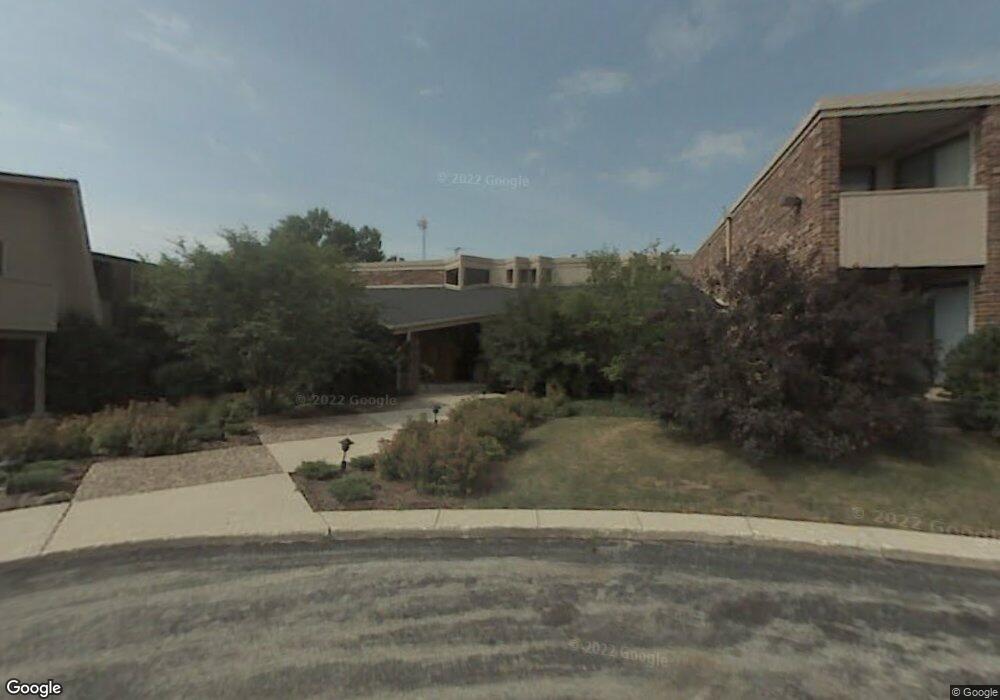
425 W Willow Ct Unit 242 Milwaukee, WI 53217
Estimated Value: $152,000 - $227,000
2
Beds
2
Baths
--
Sq Ft
1,002
Sq Ft Lot
About This Home
This home is located at 425 W Willow Ct Unit 242, Milwaukee, WI 53217 and is currently estimated at $180,879. 425 W Willow Ct Unit 242 is a home located in Milwaukee County with nearby schools including Stormonth Elementary School, Bayside Middle School, and Nicolet High School.
Ownership History
Date
Name
Owned For
Owner Type
Purchase Details
Closed on
May 2, 2022
Sold by
Klingman Timothy R
Bought by
Klingman Richard J
Current Estimated Value
Purchase Details
Closed on
Nov 15, 2016
Sold by
Klingman William J and Klingman Virginia M
Bought by
Klingman Timothy R
Home Financials for this Owner
Home Financials are based on the most recent Mortgage that was taken out on this home.
Original Mortgage
$64,000
Interest Rate
4.75%
Mortgage Type
Adjustable Rate Mortgage/ARM
Purchase Details
Closed on
Apr 25, 2011
Sold by
Cohen Susan B and Markowitz Nancy A
Bought by
Klingman William J and Klingman Virginia M
Home Financials for this Owner
Home Financials are based on the most recent Mortgage that was taken out on this home.
Original Mortgage
$48,000
Interest Rate
5.12%
Mortgage Type
New Conventional
Purchase Details
Closed on
Dec 31, 2009
Sold by
Cohen Susan B
Bought by
Cohen Susan B and Markowitz Nancy A
Purchase Details
Closed on
Jul 8, 1996
Sold by
Lang Paul R and Lang Suzanne M
Bought by
Markowitz Rosalind
Create a Home Valuation Report for This Property
The Home Valuation Report is an in-depth analysis detailing your home's value as well as a comparison with similar homes in the area
Home Values in the Area
Average Home Value in this Area
Purchase History
| Date | Buyer | Sale Price | Title Company |
|---|---|---|---|
| Klingman Richard J | $105,000 | None Listed On Document | |
| Klingman Timothy R | $80,000 | None Available | |
| Klingman William J | $60,000 | None Available | |
| Cohen Susan B | -- | None Available | |
| Markowitz Rosalind | $91,900 | -- |
Source: Public Records
Mortgage History
| Date | Status | Borrower | Loan Amount |
|---|---|---|---|
| Previous Owner | Klingman Timothy R | $64,000 | |
| Previous Owner | Klingman William J | $48,000 |
Source: Public Records
Tax History Compared to Growth
Tax History
| Year | Tax Paid | Tax Assessment Tax Assessment Total Assessment is a certain percentage of the fair market value that is determined by local assessors to be the total taxable value of land and additions on the property. | Land | Improvement |
|---|---|---|---|---|
| 2024 | $2,312 | -- | -- | -- |
| 2023 | $2,495 | $122,000 | $25,000 | $97,000 |
| 2022 | $2,286 | $100,500 | $25,000 | $75,500 |
| 2021 | $2,286 | $100,500 | $25,000 | $75,500 |
| 2020 | $2,367 | $100,500 | $25,000 | $75,500 |
| 2019 | $2,321 | $99,000 | $25,000 | $74,000 |
| 2018 | $2,321 | $99,000 | $25,000 | $74,000 |
| 2017 | $2,298 | $99,000 | $25,000 | $74,000 |
| 2016 | $1,382 | $59,000 | $27,700 | $31,300 |
| 2015 | $1,373 | $59,000 | $27,700 | $31,300 |
| 2014 | $1,401 | $59,000 | $27,700 | $31,300 |
Source: Public Records
Map
Nearby Homes
- 425 W Willow Ct Unit 153
- 474 W Willow Ct
- 8155 N Mohawk Rd
- 8209 N Port Washington Rd
- 705 W Bradley Rd
- 251 W Nokomis Ct
- 8031 N Whitney Rd
- 8201 N Whitney Rd
- 412 E Spooner Rd
- 7711 N Van Dyke Rd
- 102 W Calumet Rd
- 515 E Dean Rd
- 8313 N Links Way
- 202 W Brown Deer Rd
- 439 W Mall Rd
- 1445 W Heather Ln
- 1420 W Larkspur Ln
- 8500 N River Rd
- 8825 N Spruce Rd
- 9033 N Seneca Rd
- 425 W Willow Ct
- 425 W Willow Ct
- 425 W Willow Ct
- 425 W Willow Ct
- 425 W Willow Ct
- 425 W Willow Ct Unit 250
- 425 W Willow Ct Unit 249
- 425 W Willow Ct Unit 248
- 425 W Willow Ct
- 425 W Willow Ct
- 425 W Willow Ct Unit 245
- 425 W Willow Ct Unit 244
- 425 W Willow Ct
- 425 W Willow Ct Unit 241
- 425 W Willow Ct
- 425 W Willow Ct Unit 233
- 425 W Willow Ct Unit 232
- 425 W Willow Ct
- 425 W Willow Ct Unit 230
- 425 W Willow Ct Unit 229