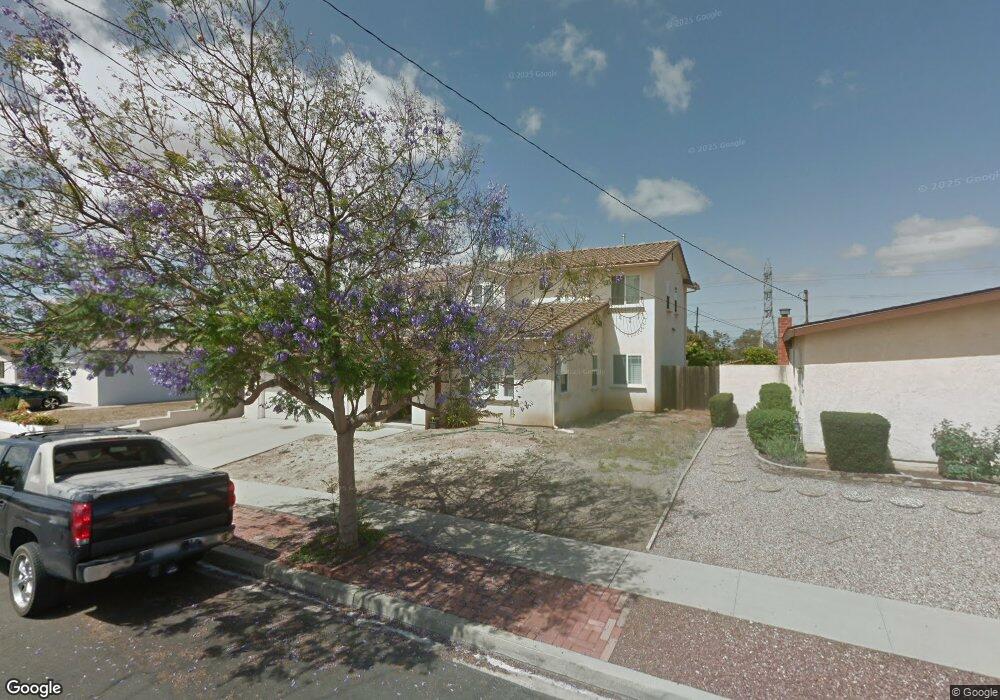
4256 Lochlomond St San Diego, CA 92111
Kearny Mesa NeighborhoodEstimated Value: $986,000 - $1,251,651
5
Beds
4
Baths
2,425
Sq Ft
$463/Sq Ft
Est. Value
About This Home
This home is located at 4256 Lochlomond St, San Diego, CA 92111 and is currently estimated at $1,123,163, approximately $463 per square foot. 4256 Lochlomond St is a home located in San Diego County with nearby schools including Ross Elementary, Montgomery Middle School, and Kavod Charter School.
Ownership History
Date
Name
Owned For
Owner Type
Purchase Details
Closed on
Apr 13, 1999
Sold by
Jorge Nieblas
Bought by
Nieblas Jorge and Nieblas Armida
Current Estimated Value
Home Financials for this Owner
Home Financials are based on the most recent Mortgage that was taken out on this home.
Original Mortgage
$134,904
Outstanding Balance
$33,990
Interest Rate
6.98%
Mortgage Type
FHA
Estimated Equity
$1,089,173
Purchase Details
Closed on
Aug 8, 1996
Sold by
Nieblas Armida
Bought by
Nieblas Jorge
Home Financials for this Owner
Home Financials are based on the most recent Mortgage that was taken out on this home.
Original Mortgage
$137,886
Interest Rate
8.23%
Mortgage Type
FHA
Purchase Details
Closed on
Jan 30, 1996
Sold by
Padilla Barbara Ann and Federal Home Loan Mortgage Cor
Bought by
Federal Home Loan Mortgage Corporation
Purchase Details
Closed on
Jul 28, 1989
Create a Home Valuation Report for This Property
The Home Valuation Report is an in-depth analysis detailing your home's value as well as a comparison with similar homes in the area
Home Values in the Area
Average Home Value in this Area
Purchase History
| Date | Buyer | Sale Price | Title Company |
|---|---|---|---|
| Nieblas Jorge | -- | Fidelity National Title Co | |
| Nieblas Jorge | -- | Chicago Title Co | |
| Nieblas Jorge | $140,000 | Chicago Title Co | |
| Federal Home Loan Mortgage Corporation | $133,727 | First Southwestern Title Co | |
| -- | $165,000 | -- |
Source: Public Records
Mortgage History
| Date | Status | Borrower | Loan Amount |
|---|---|---|---|
| Open | Nieblas Jorge | $134,904 | |
| Closed | Nieblas Jorge | $137,886 |
Source: Public Records
Tax History Compared to Growth
Tax History
| Year | Tax Paid | Tax Assessment Tax Assessment Total Assessment is a certain percentage of the fair market value that is determined by local assessors to be the total taxable value of land and additions on the property. | Land | Improvement |
|---|---|---|---|---|
| 2025 | $5,768 | $483,303 | $143,448 | $339,855 |
| 2024 | $5,768 | $473,828 | $140,636 | $333,192 |
| 2023 | $5,639 | $464,538 | $137,879 | $326,659 |
| 2022 | $5,487 | $455,430 | $135,176 | $320,254 |
| 2021 | $5,448 | $446,501 | $132,526 | $313,975 |
| 2020 | $5,382 | $441,924 | $131,168 | $310,756 |
| 2019 | $5,284 | $433,260 | $128,597 | $304,663 |
| 2018 | $4,940 | $424,766 | $126,076 | $298,690 |
| 2017 | $4,821 | $416,438 | $123,604 | $292,834 |
| 2016 | $4,742 | $408,274 | $121,181 | $287,093 |
| 2015 | $4,671 | $402,142 | $119,361 | $282,781 |
| 2014 | $4,596 | $394,265 | $117,023 | $277,242 |
Source: Public Records
Map
Nearby Homes
- 4214 Caledonia Dr
- 7434 Salerno St
- 6939 Bettyhill Dr
- 3975 Anastasia St
- 3758 Antiem St
- 4410 Charger Blvd
- 3735 Budd St
- 7003 E Batista St
- 6666 Beadnell Way
- 6666 Beadnell Way Unit 15
- 6602 Beadnell Way Unit 13
- 6535 Mount Albertine Ct
- 4261 Cannington Dr
- 7797 Stalmer St Unit 1F
- 3505 Angelucci St Unit 1M
- 3505 Angelucci St Unit 1C
- 3505 Angelucci St Unit 2E
- 7131 Malta St
- 6333 Mount Ada Rd Unit 258
- 6333 Mount Ada Rd Unit 156
- 4266 Lochlomond St
- 4246 Lochlomond St
- 7623 Kilt Ct
- 7634 Kilt Ct
- 4276 Lochlomond St
- 4236 Lochlomond St
- 7613 Kilt Ct
- 4255 Lochlomond St
- 4265 Lochlomond St
- 7624 Kilt Ct
- 4245 Lochlomond St
- 4275 Lochlomond St
- 4226 Lochlomond St
- 4235 Lochlomond St
- 7641 Armour St
- 4285 Lochlomond St
- 7614 Kilt Ct
- 4231 Kirkcaldy Dr
- 4221 Kirkcaldy Dr
- 4211 Kirkcaldy Dr