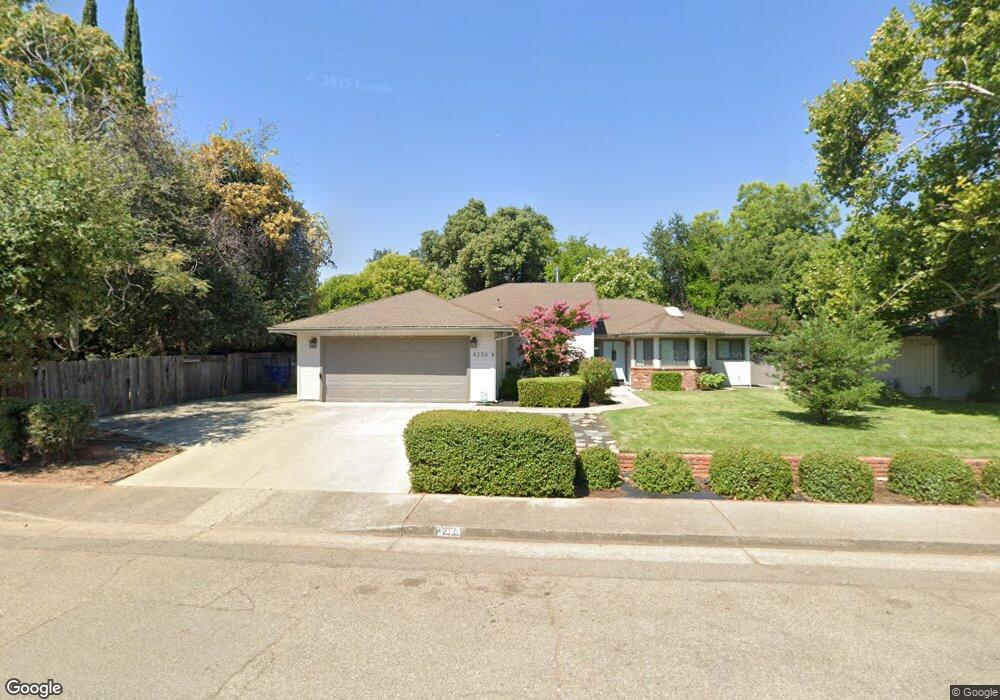
4256 Pasatiempo Ct Unit CLEAN Redding, CA 96002
South Bechelli NeighborhoodEstimated Value: $372,327 - $454,000
3
Beds
2
Baths
1,835
Sq Ft
$229/Sq Ft
Est. Value
About This Home
This home is located at 4256 Pasatiempo Ct Unit CLEAN, Redding, CA 96002 and is currently estimated at $419,832, approximately $228 per square foot. 4256 Pasatiempo Ct Unit CLEAN is a home located in Shasta County with nearby schools including Lassen View Elementary School, Parsons Junior High School, and Enterprise High School.
Ownership History
Date
Name
Owned For
Owner Type
Purchase Details
Closed on
Dec 4, 2018
Sold by
Heinrichs Harold and Heinrichs Edythe
Bought by
Heinrichs Harold F and Heinrichs Edythe M
Current Estimated Value
Purchase Details
Closed on
May 7, 2012
Sold by
Barbarick Curtis and Barbarick Lisa
Bought by
Heinrichs Harold and Heinrichs Edythe
Purchase Details
Closed on
Dec 3, 2001
Sold by
Shramek Charles E and Shramek Betty A
Bought by
Barbarick Curtis and Barbarick Lisa
Home Financials for this Owner
Home Financials are based on the most recent Mortgage that was taken out on this home.
Original Mortgage
$168,150
Interest Rate
6.67%
Purchase Details
Closed on
May 4, 1998
Sold by
Eric Batten
Bought by
Shramek Charles E and Shramek Betty A
Home Financials for this Owner
Home Financials are based on the most recent Mortgage that was taken out on this home.
Original Mortgage
$128,245
Interest Rate
7.13%
Mortgage Type
VA
Create a Home Valuation Report for This Property
The Home Valuation Report is an in-depth analysis detailing your home's value as well as a comparison with similar homes in the area
Home Values in the Area
Average Home Value in this Area
Purchase History
| Date | Buyer | Sale Price | Title Company |
|---|---|---|---|
| Heinrichs Harold F | -- | None Available | |
| Heinrichs Harold | $220,000 | First American Title Company | |
| Barbarick Curtis | $177,000 | Fidelity National Title Co | |
| Shramek Charles E | $133,000 | Placer Title Company |
Source: Public Records
Mortgage History
| Date | Status | Borrower | Loan Amount |
|---|---|---|---|
| Previous Owner | Barbarick Curtis | $168,150 | |
| Previous Owner | Shramek Charles E | $128,245 |
Source: Public Records
Tax History
| Year | Tax Paid | Tax Assessment Tax Assessment Total Assessment is a certain percentage of the fair market value that is determined by local assessors to be the total taxable value of land and additions on the property. | Land | Improvement |
|---|---|---|---|---|
| 2025 | $3,005 | $276,321 | $43,956 | $232,365 |
| 2024 | $2,963 | $270,904 | $43,095 | $227,809 |
| 2023 | $2,963 | $265,593 | $42,250 | $223,343 |
| 2022 | $2,880 | $260,386 | $41,422 | $218,964 |
| 2021 | $2,782 | $255,281 | $40,610 | $214,671 |
| 2020 | $2,770 | $252,664 | $40,194 | $212,470 |
| 2019 | $2,747 | $247,710 | $39,406 | $208,304 |
| 2018 | $2,716 | $242,854 | $38,634 | $204,220 |
| 2017 | $2,764 | $238,093 | $37,877 | $200,216 |
| 2016 | $2,586 | $233,426 | $37,135 | $196,291 |
| 2015 | $2,565 | $229,921 | $36,578 | $193,343 |
| 2014 | $2,546 | $225,418 | $35,862 | $189,556 |
Source: Public Records
Map
Nearby Homes
- 723 Woodacre Dr
- 3708 Traverse St
- 688 Julie Way
- 4323 Churn Crk Rd
- 3857 Eagle Pkwy
- 5367 Rosswood Ln
- 3500 Pioneer Ln
- 2940 Felstet Ln
- 3232 Nicolet Ln
- 1209 C St
- 3527 Adams Ln
- 1115 2nd St
- 4302 Paulson Ln
- 952 Camino Ct
- 3428 Adams Ln
- 3703 Harrow Ct
- 1108 4th St
- 0 Lot4 Unit 2 Ph 2 Stillwater Unit 25-4962
- 0 Lot3 Unit 2 Ph 2 Stillwater Unit 25-4961
- 0 Lot6 Unit 2 Ph 2 Stillwater Unit 25-4964
- 4256 Pasatiempo Ct
- 4244 Pasatiempo Ct
- 4221 Bechelli Ln
- 4232 Pasatiempo Ct
- 4205 Bechelli Ln
- 4253 Pasatiempo Ct
- 4265 Pasatiempo Ct
- 410 Woodacre Dr
- 4181 Bechelli Ln
- 4241 Pasatiempo Ct
- 4277 Pasatiempo Ct
- 404 Woodacre Dr
- 4220 Pasatiempo Ct
- 4229 Pasatiempo Ct
- 580 Woodacre Dr
- 4175 Bechelli Ln
- 0 Woodacre Drt
- 4213 Bechelli Ln
- 4201 Bechelli Ln
- 400 Woodacre Dr
Your Personal Tour Guide
Ask me questions while you tour the home.