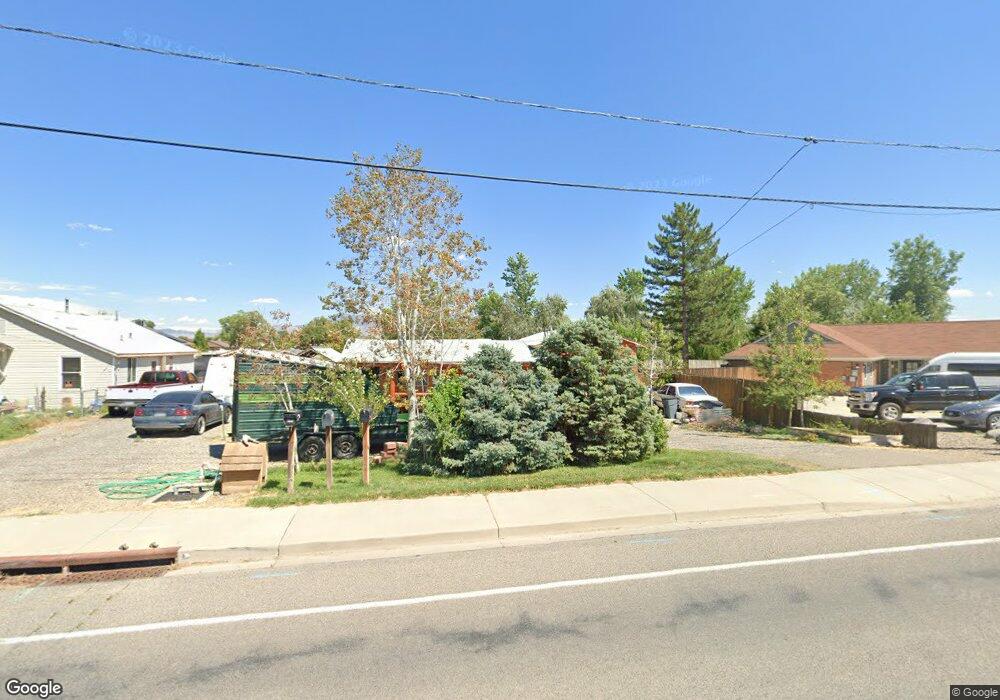
426 1/2 30 Rd Grand Junction, CO 81504
Estimated Value: $285,463 - $377,000
4
Beds
1
Bath
1,380
Sq Ft
$242/Sq Ft
Est. Value
About This Home
This home is located at 426 1/2 30 Rd, Grand Junction, CO 81504 and is currently estimated at $334,616, approximately $242 per square foot. 426 1/2 30 Rd is a home located in Mesa County with nearby schools including Pear Park Elementary School, Grand Mesa Middle School, and Central High School.
Ownership History
Date
Name
Owned For
Owner Type
Purchase Details
Closed on
May 1, 2002
Sold by
Hoover G William
Bought by
Cox David and Cox Gayle
Current Estimated Value
Home Financials for this Owner
Home Financials are based on the most recent Mortgage that was taken out on this home.
Original Mortgage
$66,500
Interest Rate
8.5%
Mortgage Type
Seller Take Back
Purchase Details
Closed on
Dec 6, 2001
Sold by
Hoover G William
Bought by
Hoover G William
Purchase Details
Closed on
Dec 22, 1997
Sold by
Hoover G William
Bought by
Trans Colo Venture
Purchase Details
Closed on
Dec 28, 1995
Sold by
Oman Donald Todd
Bought by
Cox Gayle
Purchase Details
Closed on
Jun 19, 1995
Sold by
Oman Robert D
Bought by
Cox Gayle
Purchase Details
Closed on
May 26, 1995
Sold by
Wilson Carolyn Ann
Bought by
Cox Gayle
Purchase Details
Closed on
Mar 2, 1994
Sold by
Wilson James W
Bought by
Cox Gayle
Create a Home Valuation Report for This Property
The Home Valuation Report is an in-depth analysis detailing your home's value as well as a comparison with similar homes in the area
Home Values in the Area
Average Home Value in this Area
Purchase History
| Date | Buyer | Sale Price | Title Company |
|---|---|---|---|
| Cox David | -- | None Available | |
| Hoover G William | -- | -- | |
| Trans Colo Venture | -- | -- | |
| Cox Gayle | $40,000 | -- | |
| Cox Gayle | -- | -- | |
| Cox Gayle | $52,900 | -- | |
| Cox Gayle | -- | -- |
Source: Public Records
Mortgage History
| Date | Status | Borrower | Loan Amount |
|---|---|---|---|
| Previous Owner | Cox David | $66,500 |
Source: Public Records
Tax History Compared to Growth
Tax History
| Year | Tax Paid | Tax Assessment Tax Assessment Total Assessment is a certain percentage of the fair market value that is determined by local assessors to be the total taxable value of land and additions on the property. | Land | Improvement |
|---|---|---|---|---|
| 2024 | $788 | $10,600 | $3,230 | $7,370 |
| 2023 | $788 | $10,600 | $3,230 | $7,370 |
| 2022 | $872 | $11,520 | $3,200 | $8,320 |
| 2021 | $876 | $11,850 | $3,290 | $8,560 |
| 2020 | $693 | $9,580 | $3,220 | $6,360 |
| 2019 | $657 | $9,580 | $3,220 | $6,360 |
| 2018 | $617 | $8,240 | $2,160 | $6,080 |
| 2017 | $615 | $8,240 | $2,160 | $6,080 |
| 2016 | $544 | $8,420 | $2,390 | $6,030 |
| 2015 | $552 | $8,420 | $2,390 | $6,030 |
| 2014 | $613 | $9,380 | $1,990 | $7,390 |
Source: Public Records
Map
Nearby Homes
- 431 Colorow Dr
- 3014 Colorado Ct
- 432 Marianne Dr
- 410 Marianne Dr
- 442 Florence Rd
- 408 Marianne Dr
- 3025 Red Pear Dr
- 397 Trenton Ct Unit A
- 395 Trenton Ct Unit A
- 3031 Red Pear Dr
- 2992 Debra St Unit A
- 3033 Prickly Pear Dr
- 421 Brealyn Ct
- 2910 D Rd
- 2910 D Rd Unit 1 AC
- 2910 D Rd Unit 1 Acre
- 2910 D Rd Unit 3.2 AC
- 2979 D 1 2 Rd
- 2969 Noah Ct
- 434 Devon Ct