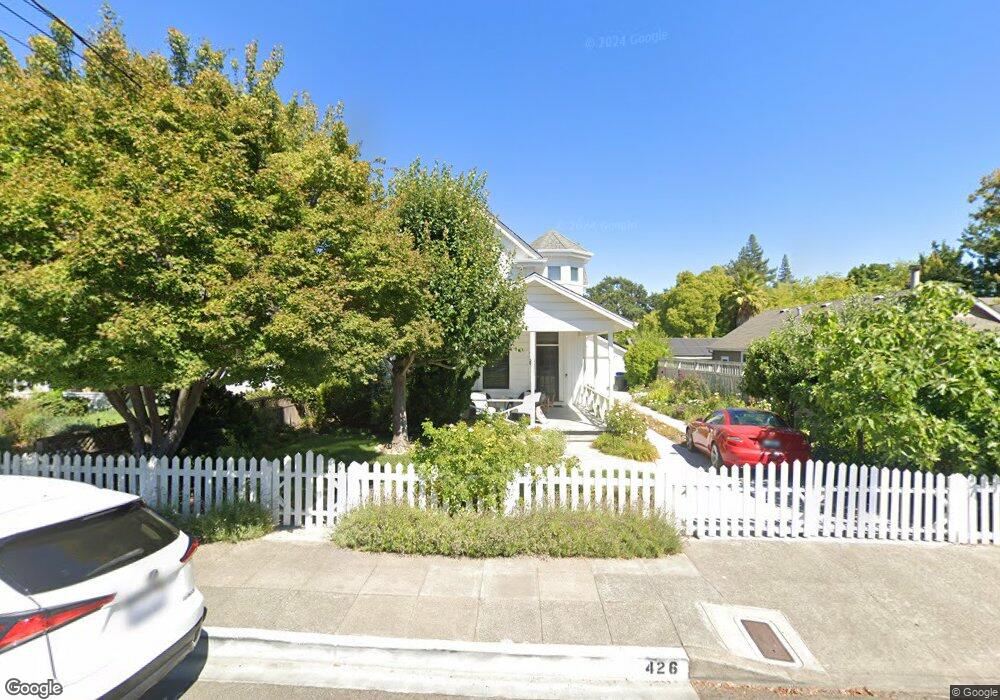
426 2nd St E Sonoma, CA 95476
Estimated Value: $1,351,505 - $1,730,000
2
Beds
3
Baths
1,905
Sq Ft
$791/Sq Ft
Est. Value
About This Home
This home is located at 426 2nd St E, Sonoma, CA 95476 and is currently estimated at $1,507,126, approximately $791 per square foot. 426 2nd St E is a home located in Sonoma County with nearby schools including Prestwood Elementary School, Adele Harrison Middle School, and Creekside High School.
Ownership History
Date
Name
Owned For
Owner Type
Purchase Details
Closed on
Mar 14, 2025
Sold by
Blattner Kimberly P
Bought by
Kimberly Blattner Revocable Trust and Blattner
Current Estimated Value
Purchase Details
Closed on
Aug 2, 1996
Sold by
Blattner Simon J and Blattner Kimberly P
Bought by
Blatner Kimberly P
Purchase Details
Closed on
Nov 17, 1993
Sold by
Tubbs Ellen Maye
Bought by
Blattner Simon J and Blattner Kimberly P
Create a Home Valuation Report for This Property
The Home Valuation Report is an in-depth analysis detailing your home's value as well as a comparison with similar homes in the area
Home Values in the Area
Average Home Value in this Area
Purchase History
| Date | Buyer | Sale Price | Title Company |
|---|---|---|---|
| Kimberly Blattner Revocable Trust | -- | None Listed On Document | |
| Blatner Kimberly P | -- | -- | |
| Blattner Simon J | $270,000 | Sonoma Title Guarant |
Source: Public Records
Tax History
| Year | Tax Paid | Tax Assessment Tax Assessment Total Assessment is a certain percentage of the fair market value that is determined by local assessors to be the total taxable value of land and additions on the property. | Land | Improvement |
|---|---|---|---|---|
| 2025 | $8,942 | $534,486 | $220,949 | $313,537 |
| 2024 | $8,942 | $524,007 | $216,617 | $307,390 |
| 2023 | $8,942 | $513,733 | $212,370 | $301,363 |
| 2022 | $6,996 | $503,660 | $208,206 | $295,454 |
| 2021 | $6,837 | $493,785 | $204,124 | $289,661 |
| 2020 | $6,728 | $488,722 | $202,031 | $286,691 |
| 2019 | $6,579 | $479,140 | $198,070 | $281,070 |
| 2018 | $6,826 | $469,746 | $194,187 | $275,559 |
| 2017 | $6,356 | $460,536 | $190,380 | $270,156 |
| 2016 | $6,057 | $451,507 | $186,648 | $264,859 |
| 2015 | $5,865 | $444,726 | $183,845 | $260,881 |
| 2014 | $5,732 | $436,015 | $180,244 | $255,771 |
Source: Public Records
Map
Nearby Homes
- 230 E Napa St
- 255 E Napa St
- 151 E Napa St
- 254 1st St E
- 226 1st St E
- 216 1st St E
- 195 Guadalupe Dr Unit 2
- 301 1st St W
- 670 Oak Ln
- 159 Guadalupe Dr
- 5100 Lovall Valley Rd
- 183 France St
- 649 1st St W Unit 1
- 690 Hudson Ct
- 775 4th St E
- 851 2nd St E
- 760 5th St E
- 805 1st St W Unit G
- 257 Perkins St
- 856 4th St E
Your Personal Tour Guide
Ask me questions while you tour the home.