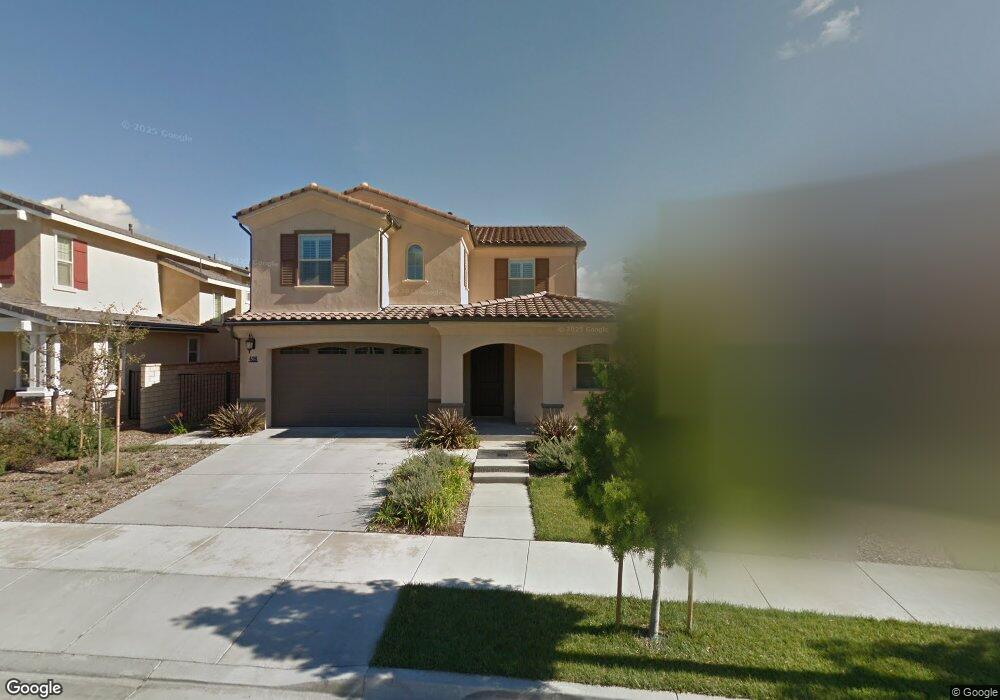
426 Bloomfield Place Camarillo, CA 93012
Estimated Value: $1,284,201 - $1,390,000
4
Beds
3
Baths
3,234
Sq Ft
$419/Sq Ft
Est. Value
About This Home
This home is located at 426 Bloomfield Place, Camarillo, CA 93012 and is currently estimated at $1,355,300, approximately $419 per square foot. 426 Bloomfield Place is a home with nearby schools including Rancho Rosal Elementary School, Monte Vista Middle School, and Adolfo Camarillo High School.
Ownership History
Date
Name
Owned For
Owner Type
Purchase Details
Closed on
Jan 16, 2021
Sold by
Wong Austin Hon and Wong Rita Fongyu
Bought by
Wong Austin and Wong Rita
Current Estimated Value
Home Financials for this Owner
Home Financials are based on the most recent Mortgage that was taken out on this home.
Original Mortgage
$583,000
Outstanding Balance
$516,743
Interest Rate
2.71%
Mortgage Type
New Conventional
Estimated Equity
$838,557
Purchase Details
Closed on
Dec 14, 2019
Sold by
Wong Austin and Wong Rita
Bought by
Wong Austin and Wong Rita
Purchase Details
Closed on
Nov 4, 2015
Sold by
Camarillo Village Park Llc
Bought by
Wong Austin and Hsiung Rita
Home Financials for this Owner
Home Financials are based on the most recent Mortgage that was taken out on this home.
Original Mortgage
$646,900
Interest Rate
3.94%
Mortgage Type
New Conventional
Create a Home Valuation Report for This Property
The Home Valuation Report is an in-depth analysis detailing your home's value as well as a comparison with similar homes in the area
Home Values in the Area
Average Home Value in this Area
Purchase History
| Date | Buyer | Sale Price | Title Company |
|---|---|---|---|
| Wong Austin | -- | Pacific Coast Title Company | |
| Wong Austin Hon | -- | Pacific Coast Title Company | |
| Wong Austin | -- | None Available | |
| Wong Austin | $822,000 | First American Title Hsd |
Source: Public Records
Mortgage History
| Date | Status | Borrower | Loan Amount |
|---|---|---|---|
| Open | Wong Austin Hon | $583,000 | |
| Previous Owner | Wong Austin | $646,900 |
Source: Public Records
Tax History
| Year | Tax Paid | Tax Assessment Tax Assessment Total Assessment is a certain percentage of the fair market value that is determined by local assessors to be the total taxable value of land and additions on the property. | Land | Improvement |
|---|---|---|---|---|
| 2025 | $10,560 | $972,955 | $632,144 | $340,811 |
| 2024 | $10,560 | $953,878 | $619,749 | $334,129 |
| 2023 | $10,179 | $935,175 | $607,597 | $327,578 |
| 2022 | $10,148 | $916,839 | $595,684 | $321,155 |
| 2021 | $9,781 | $898,862 | $584,004 | $314,858 |
| 2020 | $9,746 | $889,648 | $578,017 | $311,631 |
| 2019 | $9,702 | $872,205 | $566,684 | $305,521 |
| 2018 | $9,522 | $855,104 | $555,573 | $299,531 |
| 2017 | $8,958 | $838,338 | $544,680 | $293,658 |
| 2016 | $8,741 | $821,900 | $534,000 | $287,900 |
| 2015 | $2,365 | $214,000 | $190,000 | $24,000 |
| 2014 | $1,625 | $150,000 | $150,000 | $0 |
Source: Public Records
Map
Nearby Homes
- 3773 Golden Pond Dr
- 409 Spring Park Rd
- 142 Via Rosal
- 406 Town Forest Ct
- 288 Lightwood St Unit 114
- 4253 Pancho Rd
- 91 Via Gabilan Unit 91
- 167 Bellafonte Ct
- 65 Via Sintra
- 259 Riverdale Ct Unit 241
- 259 Riverdale Ct Unit 263
- 48 Via Lisboa Unit 48
- 230 Spindlewood Ave
- 24 Via Rosal Unit 24
- 31 Via Paloma
- 227 Calle de la Rosa
- 2862 Via Descanso
- 302 Marlee Ln
- Plan A at Palmera
- Plan C at Palmera
- 404 Bloomfield Place
- 448 Bloomfield Place
- 408 Bloomfield Place
- 427 Elm Cottage Ct
- 449 Elm Cottage Ct
- 405 Elm Cottage Ct
- 462 Bloomfield Place
- 463 Elm Cottage Ct
- 425 Bloomfield Place
- 484 Bloomfield Place
- 403 Bloomfield Place
- 485 Elm Cottage Ct
- 447 Bloomfield Place
- 469 Bloomfield Place
- 506 Bloomfield Place
- 505 Elm Cottage Ct
- 3778 Hedge Ln
- 3784 Hedge Ln
- 3766 Hedge Ln
- 442 Elm Cottage Ct
Your Personal Tour Guide
Ask me questions while you tour the home.