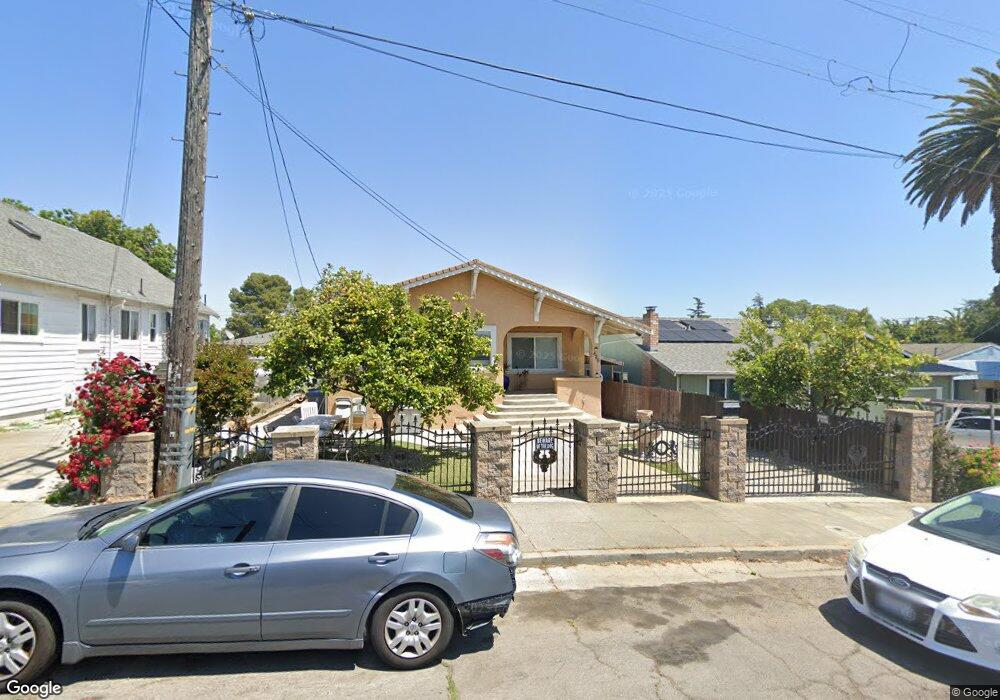
426 Grant St Vallejo, CA 94590
South Vallejo NeighborhoodEstimated Value: $308,000 - $382,000
2
Beds
1
Bath
1,438
Sq Ft
$246/Sq Ft
Est. Value
About This Home
This home is located at 426 Grant St, Vallejo, CA 94590 and is currently estimated at $354,238, approximately $246 per square foot. 426 Grant St is a home located in Solano County with nearby schools including Grace Patterson Elementary School, Vallejo High School, and Mustard Seed Preschool and Kindergarten.
Ownership History
Date
Name
Owned For
Owner Type
Purchase Details
Closed on
Oct 7, 2025
Sold by
Caro Crescencio
Bought by
Gonzalez Jesus Alberto and Gonzalez Sandra
Current Estimated Value
Purchase Details
Closed on
Jul 27, 2015
Sold by
Caro Matilde
Bought by
Caro Cresencio
Home Financials for this Owner
Home Financials are based on the most recent Mortgage that was taken out on this home.
Original Mortgage
$181,500
Interest Rate
3.98%
Mortgage Type
Purchase Money Mortgage
Purchase Details
Closed on
Apr 3, 2015
Sold by
Caro Crescencio
Bought by
Gonzalez Jesus
Purchase Details
Closed on
May 12, 2010
Sold by
Gonzalez Jesus
Bought by
Caro Cresencio
Purchase Details
Closed on
May 15, 2006
Sold by
Gonzalez Sandra
Bought by
Gonzalez Jesus
Home Financials for this Owner
Home Financials are based on the most recent Mortgage that was taken out on this home.
Original Mortgage
$304,000
Interest Rate
6.52%
Mortgage Type
Fannie Mae Freddie Mac
Purchase Details
Closed on
Apr 7, 2003
Sold by
Caro Matilde
Bought by
Caro Crescencio
Home Financials for this Owner
Home Financials are based on the most recent Mortgage that was taken out on this home.
Original Mortgage
$180,000
Interest Rate
6%
Purchase Details
Closed on
Mar 21, 2003
Sold by
Deponte Patrick S K
Bought by
Caro Crescencio and Caro Arnulfo
Home Financials for this Owner
Home Financials are based on the most recent Mortgage that was taken out on this home.
Original Mortgage
$180,000
Interest Rate
6%
Purchase Details
Closed on
Sep 21, 1999
Sold by
Guerra Abraham G and Guerra Sarah G
Bought by
Deponte Patrick S K
Home Financials for this Owner
Home Financials are based on the most recent Mortgage that was taken out on this home.
Original Mortgage
$109,293
Interest Rate
8.09%
Mortgage Type
FHA
Create a Home Valuation Report for This Property
The Home Valuation Report is an in-depth analysis detailing your home's value as well as a comparison with similar homes in the area
Home Values in the Area
Average Home Value in this Area
Purchase History
| Date | Buyer | Sale Price | Title Company |
|---|---|---|---|
| Gonzalez Jesus Alberto | -- | None Listed On Document | |
| Caro Cresencio | -- | Orange Coast Title Co Norcal | |
| Caro Cresencio | $181,500 | Orange Coast Title Co Norcal | |
| Gonzalez Jesus | -- | None Available | |
| Caro Cresencio | $100,000 | Old Republic Title Company | |
| Caro Cresencio | -- | Old Republic Title Company | |
| Gonzalez Jesus | -- | Commonwealth Land Title Co | |
| Gonzalez Jesus | $380,000 | Liberty Title Company | |
| Caro Crescencio | -- | Chicago Title Co | |
| Caro Crescencio | $225,000 | Chicago Title Co | |
| Deponte Patrick S K | $110,000 | North American Title Co |
Source: Public Records
Mortgage History
| Date | Status | Borrower | Loan Amount |
|---|---|---|---|
| Previous Owner | Caro Cresencio | $181,500 | |
| Previous Owner | Gonzalez Jesus | $304,000 | |
| Previous Owner | Gonzalez Jesus | $76,000 | |
| Previous Owner | Caro Crescencio | $180,000 | |
| Previous Owner | Deponte Patrick S K | $109,293 | |
| Closed | Deponte Patrick S K | $5,500 | |
| Closed | Caro Crescencio | $45,000 |
Source: Public Records
Tax History
| Year | Tax Paid | Tax Assessment Tax Assessment Total Assessment is a certain percentage of the fair market value that is determined by local assessors to be the total taxable value of land and additions on the property. | Land | Improvement |
|---|---|---|---|---|
| 2025 | $3,090 | $129,077 | $32,268 | $96,809 |
| 2024 | $3,090 | $126,547 | $31,636 | $94,911 |
| 2023 | $2,935 | $124,066 | $31,016 | $93,050 |
| 2022 | $2,262 | $121,634 | $30,408 | $91,226 |
| 2021 | $2,211 | $119,250 | $29,812 | $89,438 |
| 2020 | $2,200 | $118,028 | $29,507 | $88,521 |
| 2019 | $2,114 | $115,715 | $28,929 | $86,786 |
| 2018 | $1,965 | $113,447 | $28,362 | $85,085 |
| 2017 | $1,859 | $111,223 | $27,806 | $83,417 |
| 2016 | $2,481 | $214,000 | $50,000 | $164,000 |
| 2015 | $1,192 | $107,402 | $26,850 | $80,552 |
| 2014 | $1,174 | $105,300 | $26,325 | $78,975 |
Source: Public Records
Map
Nearby Homes
- 435 Grant St
- 414 Mclane St
- 615 Mclane St
- 412 Mclane St
- 644 Porter St
- 816 Grant St
- 227 Evans Ave
- 526 Jersey St
- 317 San Marcus Dr
- 315 Evans Ave
- 314 San Marcus Dr
- 1115 Solano Ave
- 410 San Gabriel Dr Unit 410
- 321 Benicia Rd
- 320 & 322 Evans Ave
- 902 Maine St
- 401 Central Ave
- 316 Napa St
- 312 Central Ave
- 1434 Beach St
Your Personal Tour Guide
Ask me questions while you tour the home.