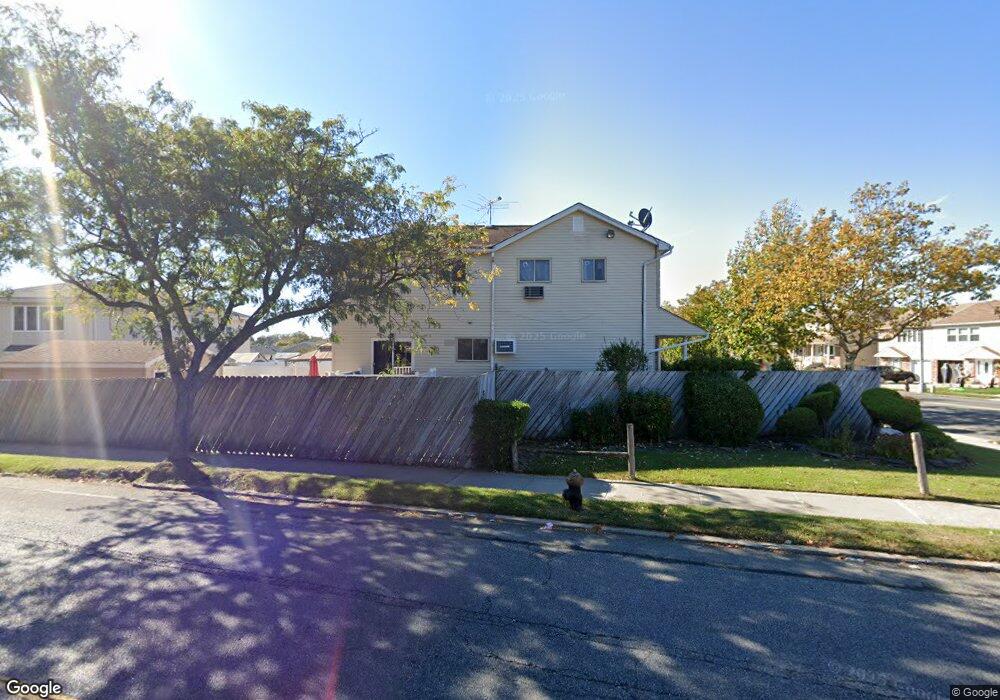
426 Katan Ave Staten Island, NY 10308
Eltingville NeighborhoodEstimated Value: $669,000 - $722,000
3
Beds
2
Baths
1,100
Sq Ft
$634/Sq Ft
Est. Value
About This Home
This home is located at 426 Katan Ave, Staten Island, NY 10308 and is currently estimated at $697,289, approximately $633 per square foot. 426 Katan Ave is a home located in Richmond County with nearby schools including P.S. 32 The Gifford School, Myra S. Barnes Intermediate School 24, and New Dorp High School.
Ownership History
Date
Name
Owned For
Owner Type
Purchase Details
Closed on
Dec 30, 2020
Sold by
Stone Steven and Melendez Tina Marie
Bought by
Melendez Tina Marie
Current Estimated Value
Home Financials for this Owner
Home Financials are based on the most recent Mortgage that was taken out on this home.
Original Mortgage
$390,000
Outstanding Balance
$349,825
Interest Rate
3%
Mortgage Type
New Conventional
Estimated Equity
$347,464
Purchase Details
Closed on
Feb 12, 2010
Sold by
Lustgarten Larry
Bought by
Stone Steven and Stone Tina
Home Financials for this Owner
Home Financials are based on the most recent Mortgage that was taken out on this home.
Original Mortgage
$356,425
Interest Rate
5.5%
Mortgage Type
FHA
Purchase Details
Closed on
Jun 7, 2001
Sold by
Lustgarten Larry and Lustgarten Dolores
Bought by
Lustgarten Larry
Create a Home Valuation Report for This Property
The Home Valuation Report is an in-depth analysis detailing your home's value as well as a comparison with similar homes in the area
Home Values in the Area
Average Home Value in this Area
Purchase History
| Date | Buyer | Sale Price | Title Company |
|---|---|---|---|
| Melendez Tina Marie | -- | First Equity Abstract Corp | |
| Stone Steven | $363,000 | None Available | |
| Lustgarten Larry | -- | Washington Title Insurance C |
Source: Public Records
Mortgage History
| Date | Status | Borrower | Loan Amount |
|---|---|---|---|
| Open | Melendez Tina Marie | $390,000 | |
| Closed | Stone Steven | $356,425 |
Source: Public Records
Tax History Compared to Growth
Tax History
| Year | Tax Paid | Tax Assessment Tax Assessment Total Assessment is a certain percentage of the fair market value that is determined by local assessors to be the total taxable value of land and additions on the property. | Land | Improvement |
|---|---|---|---|---|
| 2025 | $6,088 | $41,040 | $6,483 | $34,557 |
| 2024 | $6,088 | $38,820 | $6,466 | $32,354 |
| 2023 | $5,808 | $28,598 | $6,335 | $22,263 |
| 2022 | $5,709 | $33,720 | $8,280 | $25,440 |
| 2021 | $5,973 | $32,100 | $8,280 | $23,820 |
| 2020 | $5,668 | $32,640 | $8,280 | $24,360 |
| 2019 | $5,284 | $31,260 | $8,280 | $22,980 |
| 2018 | $4,858 | $23,832 | $6,895 | $16,937 |
| 2017 | $4,858 | $23,832 | $7,543 | $16,289 |
| 2016 | $4,728 | $23,652 | $7,734 | $15,918 |
| 2015 | $4,040 | $22,314 | $6,631 | $15,683 |
| 2014 | $4,040 | $21,051 | $6,438 | $14,613 |
Source: Public Records
Map
Nearby Homes
- 32 Ovas Ct
- 1 Patty Ct
- 43 Fern Ave
- 166 Genesee Ave
- 24 E Augusta Ave
- 41 Middle Loop Rd
- 115 Abingdon Ave
- 219 Eltingville Blvd
- 65 E Scranton Ave
- 151 Abingdon Ave
- 420 Getz Ave
- 57 Middle Loop Rd
- 63 Genesee Ave
- 254 Ridgewood Ave
- 67 Wilson Ave
- 280 Eltingville Blvd
- 284 Eltingville Blvd
- 288 Eltingville Blvd
- 292 Eltingville Blvd
- 296 Eltingville Blvd