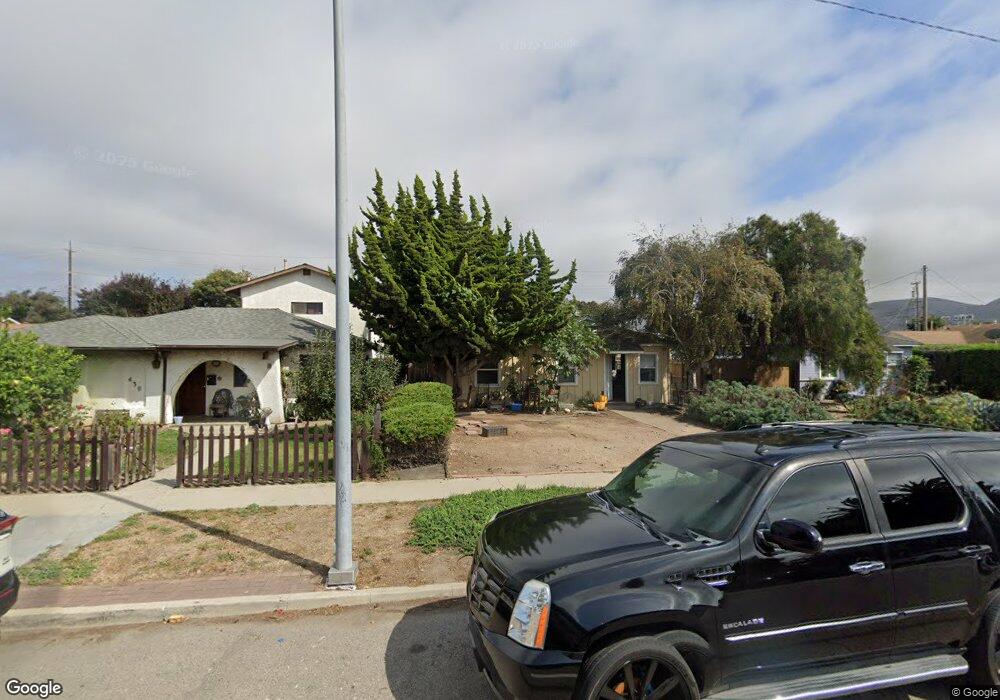
426 N G St Lompoc, CA 93436
Estimated Value: $432,000 - $577,000
3
Beds
1
Bath
856
Sq Ft
$602/Sq Ft
Est. Value
About This Home
This home is located at 426 N G St, Lompoc, CA 93436 and is currently estimated at $515,605, approximately $602 per square foot. 426 N G St is a home located in Santa Barbara County with nearby schools including Arthur Hapgood Elementary School, Lompoc Valley Middle School, and Lompoc High School.
Ownership History
Date
Name
Owned For
Owner Type
Purchase Details
Closed on
Oct 11, 2023
Sold by
Valerie K Sudbury Trust and Sudbury Rod Lyle
Bought by
East College Avenue Llc
Current Estimated Value
Purchase Details
Closed on
May 26, 2006
Sold by
Sudbury Delia L
Bought by
Sudbury Valerie K
Home Financials for this Owner
Home Financials are based on the most recent Mortgage that was taken out on this home.
Original Mortgage
$475,000
Interest Rate
6.52%
Mortgage Type
Purchase Money Mortgage
Create a Home Valuation Report for This Property
The Home Valuation Report is an in-depth analysis detailing your home's value as well as a comparison with similar homes in the area
Home Values in the Area
Average Home Value in this Area
Purchase History
| Date | Buyer | Sale Price | Title Company |
|---|---|---|---|
| East College Avenue Llc | -- | None Listed On Document | |
| Sudbury Valerie K | $475,000 | Chicago Title Company |
Source: Public Records
Mortgage History
| Date | Status | Borrower | Loan Amount |
|---|---|---|---|
| Previous Owner | Sudbury Valerie K | $475,000 |
Source: Public Records
Tax History
| Year | Tax Paid | Tax Assessment Tax Assessment Total Assessment is a certain percentage of the fair market value that is determined by local assessors to be the total taxable value of land and additions on the property. | Land | Improvement |
|---|---|---|---|---|
| 2025 | $3,435 | $314,477 | $14,206 | $300,271 |
| 2023 | $3,435 | $302,267 | $13,655 | $288,612 |
| 2022 | $3,376 | $296,341 | $13,388 | $282,953 |
| 2021 | $3,413 | $290,531 | $13,126 | $277,405 |
| 2020 | $3,377 | $287,553 | $12,992 | $274,561 |
| 2019 | $3,322 | $281,916 | $12,738 | $269,178 |
| 2018 | $3,271 | $276,389 | $12,489 | $263,900 |
| 2017 | $3,211 | $270,971 | $12,245 | $258,726 |
| 2016 | $3,153 | $265,658 | $12,005 | $253,653 |
| 2014 | $3,087 | $256,543 | $11,594 | $244,949 |
Source: Public Records
Map
Nearby Homes
- 510 N I St
- 230 N D St
- 600 N Larkspur St
- 321 N K St
- 610 E Pine Ave Unit 10
- 610 E Pine Ave Unit 29
- 622 N B St
- 801, 851 California 246
- 526 N L St
- 505 N 1st St
- 113 N B St
- 117 S I St
- 615 N 1st St
- 701 E Pine Ave Unit 182
- 701 E Pine Ave Unit 176
- 701 E Pine Ave Unit 171
- 701 E Pine Ave Unit 161
- 217 N M St
- 215 S H St
- 531 N O St
Your Personal Tour Guide
Ask me questions while you tour the home.