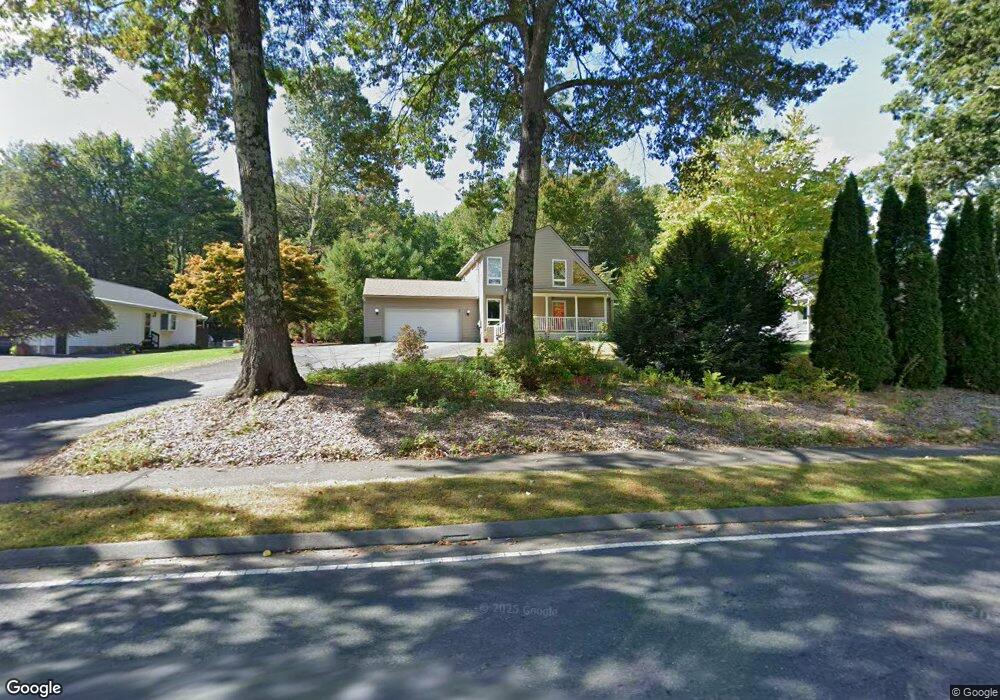
426 Spring St Florence, MA 01062
Florence NeighborhoodEstimated Value: $568,000 - $659,000
3
Beds
3
Baths
1,850
Sq Ft
$331/Sq Ft
Est. Value
About This Home
This home is located at 426 Spring St, Florence, MA 01062 and is currently estimated at $612,551, approximately $331 per square foot. 426 Spring St is a home located in Hampshire County with nearby schools including Northampton High School, The Montessori School of Northampton, and Lander Grinspoon Academy.
Ownership History
Date
Name
Owned For
Owner Type
Purchase Details
Closed on
Jan 14, 1997
Sold by
Boyle James F and Boyle Patricia A
Bought by
Menon Eva M and Peters James F
Current Estimated Value
Home Financials for this Owner
Home Financials are based on the most recent Mortgage that was taken out on this home.
Original Mortgage
$80,000
Outstanding Balance
$8,461
Interest Rate
7.46%
Mortgage Type
Purchase Money Mortgage
Estimated Equity
$604,090
Create a Home Valuation Report for This Property
The Home Valuation Report is an in-depth analysis detailing your home's value as well as a comparison with similar homes in the area
Home Values in the Area
Average Home Value in this Area
Purchase History
| Date | Buyer | Sale Price | Title Company |
|---|---|---|---|
| Menon Eva M | $182,500 | -- |
Source: Public Records
Mortgage History
| Date | Status | Borrower | Loan Amount |
|---|---|---|---|
| Open | Menon Eva M | $80,000 |
Source: Public Records
Tax History
| Year | Tax Paid | Tax Assessment Tax Assessment Total Assessment is a certain percentage of the fair market value that is determined by local assessors to be the total taxable value of land and additions on the property. | Land | Improvement |
|---|---|---|---|---|
| 2025 | $7,113 | $510,600 | $142,600 | $368,000 |
| 2024 | $7,054 | $464,400 | $136,500 | $327,900 |
| 2023 | $6,694 | $422,600 | $123,600 | $299,000 |
| 2022 | $6,088 | $340,300 | $116,500 | $223,800 |
| 2021 | $5,459 | $314,300 | $111,700 | $202,600 |
| 2020 | $5,280 | $314,300 | $111,700 | $202,600 |
| 2019 | $5,001 | $287,900 | $94,400 | $193,500 |
| 2018 | $4,896 | $285,500 | $94,400 | $191,100 |
| 2017 | $4,765 | $285,500 | $94,400 | $191,100 |
| 2016 | $4,614 | $285,500 | $94,400 | $191,100 |
| 2015 | $4,732 | $299,500 | $111,700 | $187,800 |
| 2014 | $4,609 | $299,500 | $111,700 | $187,800 |
Source: Public Records
Map
Nearby Homes
- 139 Water St
- 2 Juniper Place
- 53 E Center St
- 48 Evergreen Rd Unit 306
- 44 Evergreen Rd Unit 302
- 67 Park St Unit A
- 76 Maple St
- 0 Haydenville Rd
- 42 Clark St
- 44 Sheffield Ln
- 296 Ryan Rd Unit A
- 296 Ryan Rd
- 296 Ryan Rd Unit B
- 214 Audubon Rd
- 37 Landy Ave
- 222 River Rd
- 723 Lot B Ryan Rd
- 404 Sylvester Rd
- 20-11 Sylvester Rd
- 575 Bridge Rd Unit 12-7
Your Personal Tour Guide
Ask me questions while you tour the home.