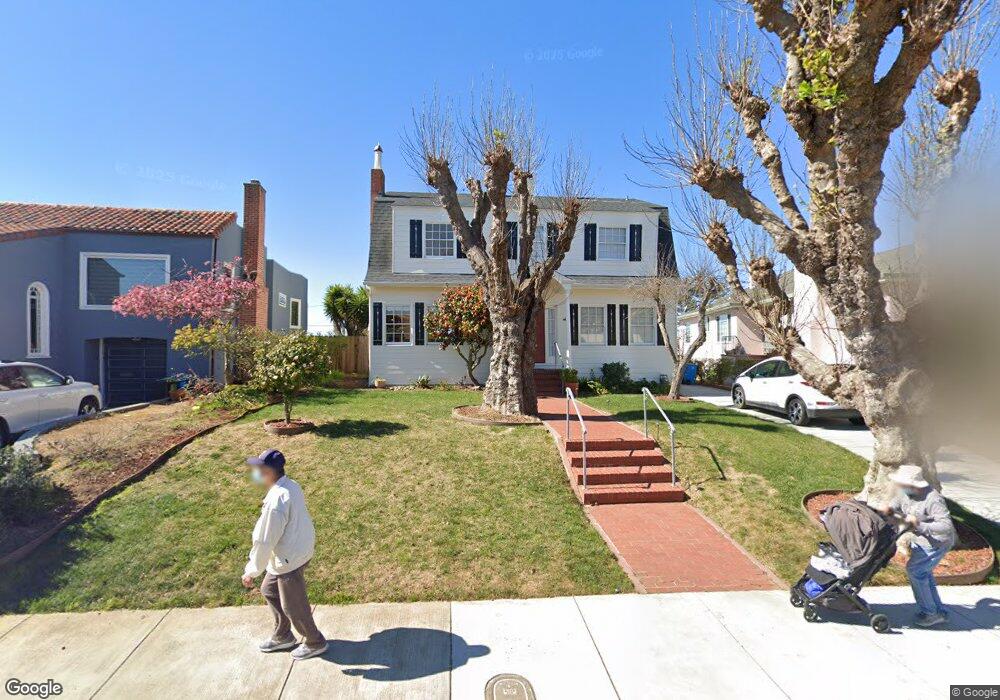
426 Urbano Dr San Francisco, CA 94127
Ingleside Terrace NeighborhoodEstimated Value: $1,784,191 - $2,258,000
--
Bed
1
Bath
2,240
Sq Ft
$918/Sq Ft
Est. Value
About This Home
This home is located at 426 Urbano Dr, San Francisco, CA 94127 and is currently estimated at $2,056,548, approximately $918 per square foot. 426 Urbano Dr is a home located in San Francisco County with nearby schools including Commodore Sloat Elementary School, Aptos Middle School, and St. Stephen School.
Ownership History
Date
Name
Owned For
Owner Type
Purchase Details
Closed on
Dec 3, 2020
Sold by
Plack Leslie and Plack Linda
Bought by
Plack Family Trust and Plack
Current Estimated Value
Home Financials for this Owner
Home Financials are based on the most recent Mortgage that was taken out on this home.
Original Mortgage
$393,000
Outstanding Balance
$349,714
Interest Rate
2.8%
Mortgage Type
New Conventional
Estimated Equity
$1,706,834
Purchase Details
Closed on
Nov 8, 2020
Sold by
Plack Leslie and Plack Linda
Bought by
Plack Leslie and Plack Linda
Home Financials for this Owner
Home Financials are based on the most recent Mortgage that was taken out on this home.
Original Mortgage
$393,000
Outstanding Balance
$349,714
Interest Rate
2.8%
Mortgage Type
New Conventional
Estimated Equity
$1,706,834
Purchase Details
Closed on
Jun 14, 2002
Sold by
Plack Leslie D and Plack Linda
Bought by
Plack Leslie and Plack Linda
Create a Home Valuation Report for This Property
The Home Valuation Report is an in-depth analysis detailing your home's value as well as a comparison with similar homes in the area
Home Values in the Area
Average Home Value in this Area
Purchase History
| Date | Buyer | Sale Price | Title Company |
|---|---|---|---|
| Plack Family Trust | -- | Old Republic Title | |
| Plack Leslie | -- | Old Republic Title | |
| Plack Leslie | -- | Old Republic Title | |
| Plack Leslie | -- | -- |
Source: Public Records
Mortgage History
| Date | Status | Borrower | Loan Amount |
|---|---|---|---|
| Open | Plack Leslie | $393,000 |
Source: Public Records
Tax History Compared to Growth
Tax History
| Year | Tax Paid | Tax Assessment Tax Assessment Total Assessment is a certain percentage of the fair market value that is determined by local assessors to be the total taxable value of land and additions on the property. | Land | Improvement |
|---|---|---|---|---|
| 2025 | $5,406 | $468,210 | $157,442 | $310,768 |
| 2024 | $5,406 | $459,030 | $154,355 | $304,675 |
| 2023 | $5,329 | $450,030 | $151,329 | $298,701 |
| 2022 | $5,855 | $441,207 | $148,362 | $292,845 |
| 2021 | $5,746 | $432,556 | $145,453 | $287,103 |
| 2020 | $5,787 | $428,122 | $143,962 | $284,160 |
| 2019 | $5,591 | $419,729 | $141,140 | $278,589 |
| 2018 | $5,403 | $411,500 | $138,373 | $273,127 |
| 2017 | $5,039 | $403,432 | $135,660 | $267,772 |
| 2016 | $4,933 | $395,522 | $133,000 | $262,522 |
| 2015 | $4,870 | $389,582 | $131,003 | $258,579 |
| 2014 | $4,482 | $381,951 | $128,437 | $253,514 |
Source: Public Records
Map
Nearby Homes