R
Landlord's Agent in 2025
Robin Chew
Northview Realty, LLC.
(404) 509-3684
1 in this area
25 Total Sales
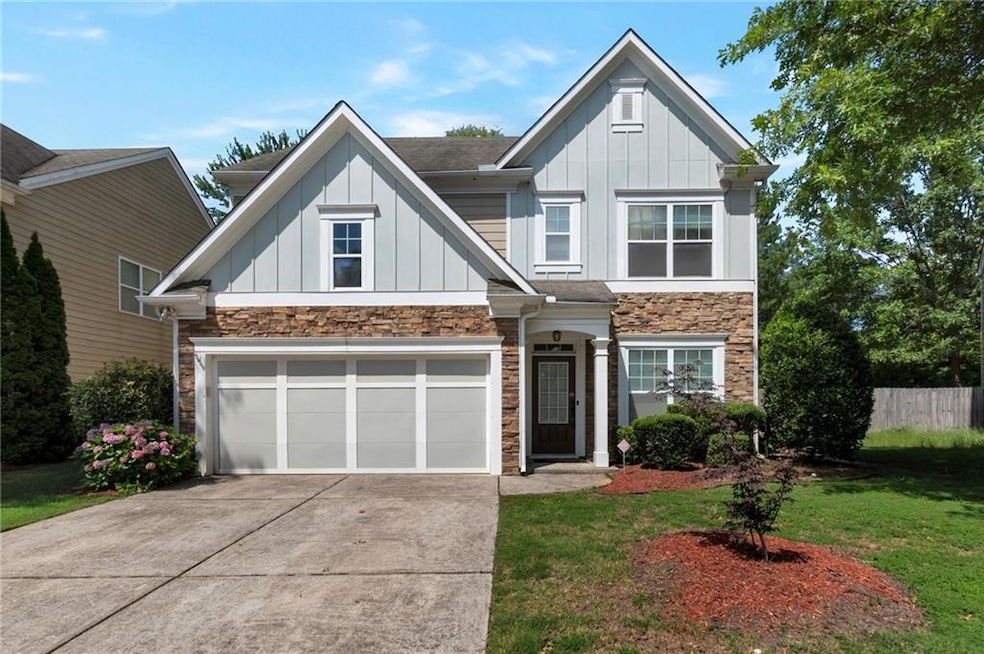
Nestled in a prime location, this exceptional home offers unparalleled convenience, just minutes from the vibrant Sugarloaf Gwinnett Arena and extensive shopping at Sugarloaf Mills. Step inside to find an impressively spacious layout featuring a gourmet kitchen, ideal for culinary enthusiasts. Entertain with ease in the generous formal dining and inviting formal living rooms. Retreat to the beautifully updated master bedroom, complemented by three additional spacious bedrooms. Revel in the abundance of natural light streaming throughout, and enjoy the serene, captivating views of the backyard. Best North Gwinnett High School district.
Last Agent to Rent the Property
Northview Realty, LLC. License #255342 Listed on: 07/01/2025
| Date | Buyer | Sale Price | Title Company |
|---|---|---|---|
| Zhang Xin | $164,000 | -- | |
| Mutari Lauren | -- | -- | |
| Blair Sarah K | $243,400 | -- |
| Date | Status | Borrower | Loan Amount |
|---|---|---|---|
| Open | Zhang Xin | $123,000 | |
| Previous Owner | Mutari Lauren | $157,500 | |
| Previous Owner | Blair Sarah K | $238,100 |
| Date | Event | Price | Change | Sq Ft Price |
|---|---|---|---|---|
| 07/20/2025 07/20/25 | Rented | $2,795 | 0.0% | -- |
| 07/07/2025 07/07/25 | Under Contract | -- | -- | -- |
| 07/01/2025 07/01/25 | For Rent | $2,795 | +64.9% | -- |
| 05/22/2020 05/22/20 | Rented | $1,695 | 0.0% | -- |
| 05/09/2020 05/09/20 | Under Contract | -- | -- | -- |
| 05/04/2020 05/04/20 | For Rent | $1,695 | 0.0% | -- |
| 01/05/2019 01/05/19 | Rented | $1,695 | 0.0% | -- |
| 10/29/2018 10/29/18 | For Rent | $1,695 | +9.4% | -- |
| 12/31/2016 12/31/16 | Rented | $1,550 | 0.0% | -- |
| 12/27/2016 12/27/16 | Under Contract | -- | -- | -- |
| 12/14/2016 12/14/16 | For Rent | $1,550 | 0.0% | -- |
| 01/31/2016 01/31/16 | Rented | $1,550 | 0.0% | -- |
| 01/26/2016 01/26/16 | Under Contract | -- | -- | -- |
| 01/06/2016 01/06/16 | For Rent | $1,550 | +5.1% | -- |
| 04/27/2015 04/27/15 | Rented | $1,475 | -1.3% | -- |
| 03/28/2015 03/28/15 | Under Contract | -- | -- | -- |
| 03/26/2015 03/26/15 | For Rent | $1,495 | +3.1% | -- |
| 11/15/2012 11/15/12 | Rented | $1,450 | -99.1% | -- |
| 11/06/2012 11/06/12 | Under Contract | -- | -- | -- |
| 10/26/2012 10/26/12 | Sold | $164,000 | 0.0% | $77 / Sq Ft |
| 10/26/2012 10/26/12 | For Rent | $1,495 | 0.0% | -- |
| 08/28/2012 08/28/12 | Pending | -- | -- | -- |
| 08/21/2012 08/21/12 | For Sale | $160,000 | -- | $75 / Sq Ft |
| Year | Tax Paid | Tax Assessment Tax Assessment Total Assessment is a certain percentage of the fair market value that is determined by local assessors to be the total taxable value of land and additions on the property. | Land | Improvement |
|---|---|---|---|---|
| 2024 | $5,296 | $151,760 | $36,800 | $114,960 |
| 2023 | $5,296 | $151,760 | $36,800 | $114,960 |
| 2022 | $5,312 | $151,760 | $36,800 | $114,960 |
| 2021 | $3,877 | $108,600 | $22,080 | $86,520 |
| 2020 | $4,335 | $108,600 | $22,080 | $86,520 |
| 2019 | $4,184 | $108,600 | $22,080 | $86,520 |
| 2018 | $3,510 | $90,680 | $24,400 | $66,280 |
| 2016 | $2,481 | $64,040 | $16,000 | $48,040 |
| 2015 | $2,510 | $64,040 | $16,000 | $48,040 |
| 2014 | $2,148 | $54,434 | $13,600 | $40,834 |
R
Landlord's Agent in 2025
Robin Chew
Northview Realty, LLC.
(404) 509-3684
1 in this area
25 Total Sales
P
Seller's Agent in 2020
ProSources Realty
Prosources Realty, LLC.
(678) 361-5228
5 Total Sales
N
Buyer's Agent in 2020
NON-MLS NMLS
Non FMLS Member

Buyer's Agent in 2019
Kelly Choi
Keller Williams Realty Atlanta Partners
(678) 704-7045
21 in this area
156 Total Sales
M
Buyer's Agent in 2016
MARITZA WILLIAMS
HomeSmart
(404) 402-3273
5 Total Sales
h
Buyer's Agent in 2015
hee shin
Virtual Properties Realty.BIZ
(678) 222-8199
2 in this area
7 Total Sales
Source: First Multiple Listing Service (FMLS)
MLS Number: 7607648
APN: 7-255-471
Disclaimer: Certain information contained herein is derived from information provided by parties other than Homes.com. All information provided is deemed reliable, but is not guaranteed to be accurate and should be independently verified.
![]() Listings identified with the FMLS IDX logo come from FMLS and are held by brokerage firms other than the owner of this website. The listing brokerage is identified in any listing details. Information is deemed reliable but is not guaranteed. If you believe any FMLS listing contains material that infringes your copyrighted work please visit www.fmls.com/dmca to review our DMCA policy and learn how to submit a takedown request. © 2025 First Multiple Listing Service, Inc.
Listings identified with the FMLS IDX logo come from FMLS and are held by brokerage firms other than the owner of this website. The listing brokerage is identified in any listing details. Information is deemed reliable but is not guaranteed. If you believe any FMLS listing contains material that infringes your copyrighted work please visit www.fmls.com/dmca to review our DMCA policy and learn how to submit a takedown request. © 2025 First Multiple Listing Service, Inc.