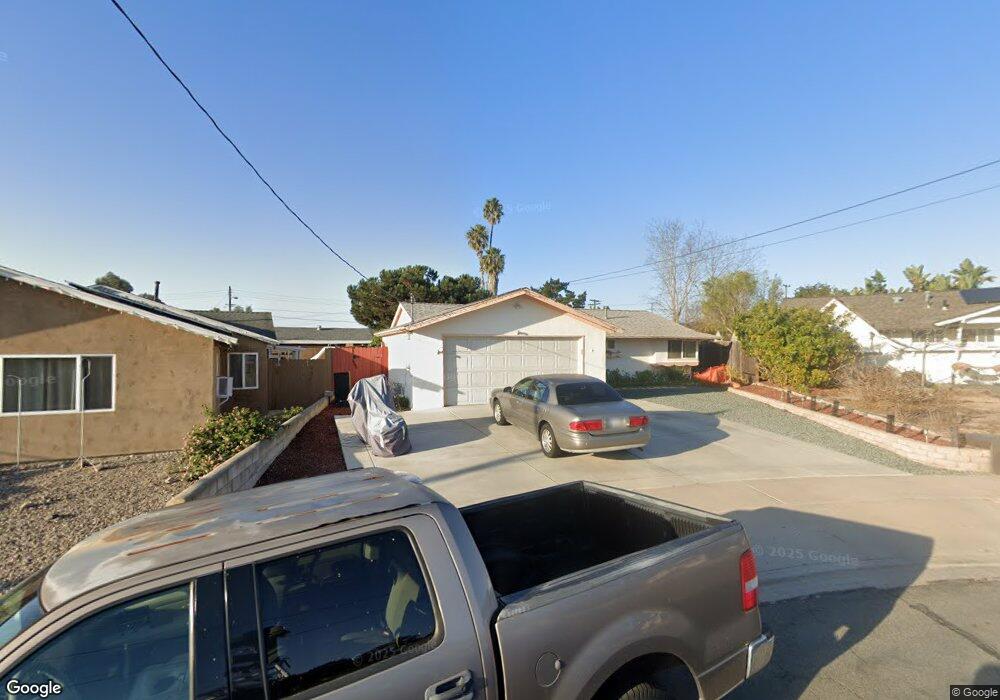
4263 Bert Ct San Diego, CA 92117
North Clairemont NeighborhoodEstimated Value: $940,663 - $1,063,000
3
Beds
2
Baths
1,048
Sq Ft
$947/Sq Ft
Est. Value
About This Home
This home is located at 4263 Bert Ct, San Diego, CA 92117 and is currently estimated at $992,166, approximately $946 per square foot. 4263 Bert Ct is a home located in San Diego County with nearby schools including Field Elementary School, Innovation Middle School, and Madison High School.
Ownership History
Date
Name
Owned For
Owner Type
Purchase Details
Closed on
Jul 10, 1998
Sold by
Oliver Brian James and Oliver Ramona Jean
Bought by
Nielsen David N and Nielsen Carol S
Current Estimated Value
Home Financials for this Owner
Home Financials are based on the most recent Mortgage that was taken out on this home.
Original Mortgage
$138,037
Outstanding Balance
$28,077
Interest Rate
6.93%
Mortgage Type
FHA
Estimated Equity
$964,089
Purchase Details
Closed on
Oct 7, 1985
Create a Home Valuation Report for This Property
The Home Valuation Report is an in-depth analysis detailing your home's value as well as a comparison with similar homes in the area
Home Values in the Area
Average Home Value in this Area
Purchase History
| Date | Buyer | Sale Price | Title Company |
|---|---|---|---|
| Nielsen David N | $140,000 | Benefit Land Title Company | |
| -- | $102,000 | -- |
Source: Public Records
Mortgage History
| Date | Status | Borrower | Loan Amount |
|---|---|---|---|
| Open | Nielsen David N | $138,037 |
Source: Public Records
Tax History Compared to Growth
Tax History
| Year | Tax Paid | Tax Assessment Tax Assessment Total Assessment is a certain percentage of the fair market value that is determined by local assessors to be the total taxable value of land and additions on the property. | Land | Improvement |
|---|---|---|---|---|
| 2025 | $2,591 | $219,457 | $77,494 | $141,963 |
| 2024 | $2,591 | $215,155 | $75,975 | $139,180 |
| 2023 | $2,532 | $210,937 | $74,486 | $136,451 |
| 2022 | $2,463 | $206,802 | $73,026 | $133,776 |
| 2021 | $2,445 | $202,748 | $71,595 | $131,153 |
| 2020 | $2,415 | $200,670 | $70,861 | $129,809 |
| 2019 | $2,370 | $196,736 | $69,472 | $127,264 |
| 2018 | $2,216 | $192,879 | $68,110 | $124,769 |
| 2017 | $81 | $189,098 | $66,775 | $122,323 |
| 2016 | $2,124 | $185,391 | $65,466 | $119,925 |
| 2015 | $2,092 | $182,607 | $64,483 | $118,124 |
| 2014 | $2,059 | $179,031 | $63,220 | $115,811 |
Source: Public Records
Map
Nearby Homes
- 4203 Tolowa St
- 4380 Rolfe Rd
- 4182 Seri St
- 4226 Mount Voss Dr
- 4576 Onondaga Ave
- 4472 Mount Lindsey Ave
- 3701 Tavara Cir
- 3582 Hatteras Ave
- 4527 Chinook Ct
- 4695 Mount Armet Dr
- 4772 Mount Gaywas Dr
- 4150 Taos Dr
- 4527 Kickapoo Ct
- 4915 Mount Gaywas Dr
- 4141 Mount Bigelow Way
- 3476 Ogalala Ave
- 4501 Bannock Ave
- 4851 Cole St Unit 1
- 4543 Moraga Ave
- 4401-3 Clairemont Mesa Blvd