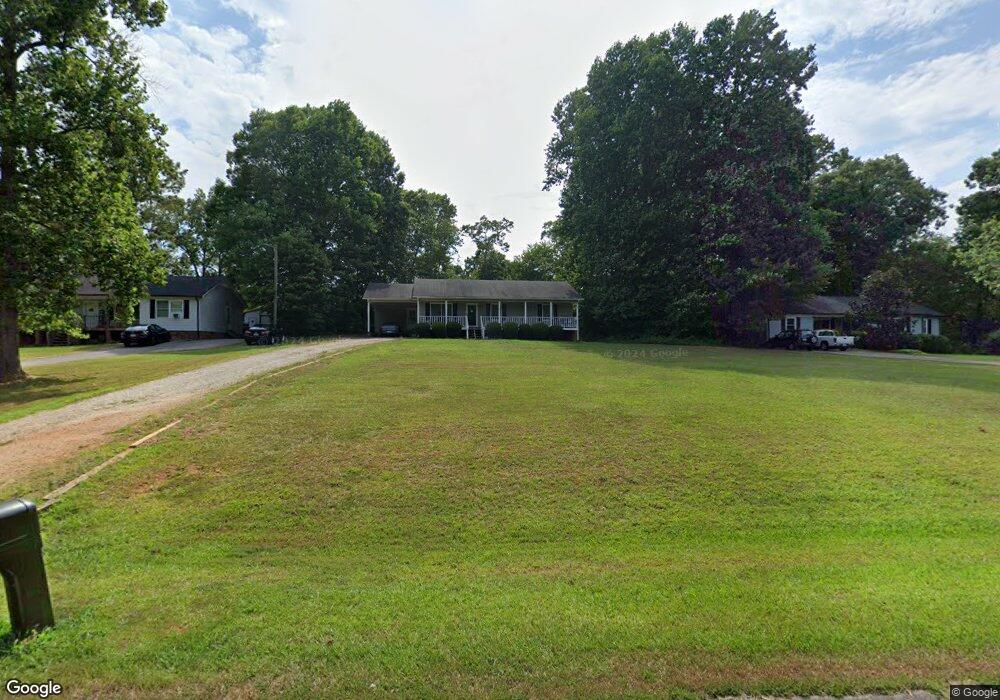
4265 Hunters Run Trinity, NC 27370
Estimated Value: $166,000 - $273,000
Studio
2
Baths
1,280
Sq Ft
$189/Sq Ft
Est. Value
About This Home
This home is located at 4265 Hunters Run, Trinity, NC 27370 and is currently estimated at $241,933, approximately $189 per square foot. 4265 Hunters Run is a home located in Randolph County with nearby schools including Trindale Elementary School, Wheatmore Middle School, and Wheatmore High School.
Ownership History
Date
Name
Owned For
Owner Type
Purchase Details
Closed on
Jan 20, 2010
Sold by
Lowe Kevin and Lowe Anne
Bought by
Thomson Melissa A
Current Estimated Value
Home Financials for this Owner
Home Financials are based on the most recent Mortgage that was taken out on this home.
Original Mortgage
$92,000
Outstanding Balance
$60,376
Interest Rate
5.02%
Mortgage Type
New Conventional
Estimated Equity
$181,557
Purchase Details
Closed on
Jan 22, 2007
Sold by
Hawkes Benjamin W and Hawkes Betty
Bought by
Lowe Kevin
Home Financials for this Owner
Home Financials are based on the most recent Mortgage that was taken out on this home.
Original Mortgage
$114,700
Interest Rate
6.08%
Mortgage Type
FHA
Purchase Details
Closed on
Dec 1, 2006
Sold by
Ramm Carlton D
Bought by
Hawkes Benjamin W
Home Financials for this Owner
Home Financials are based on the most recent Mortgage that was taken out on this home.
Original Mortgage
$114,700
Interest Rate
6.08%
Mortgage Type
FHA
Purchase Details
Closed on
Jan 5, 1995
Bought by
Thomson Melissa
Create a Home Valuation Report for This Property
The Home Valuation Report is an in-depth analysis detailing your home's value as well as a comparison with similar homes in the area
Home Values in the Area
Average Home Value in this Area
Purchase History
| Date | Buyer | Sale Price | Title Company |
|---|---|---|---|
| Thomson Melissa A | $92,000 | None Available | |
| Lowe Kevin | $116,500 | None Available | |
| Hawkes Benjamin W | $86,000 | None Available | |
| Thomson Melissa | $75,900 | -- |
Source: Public Records
Mortgage History
| Date | Status | Borrower | Loan Amount |
|---|---|---|---|
| Open | Thomson Melissa A | $92,000 | |
| Previous Owner | Lowe Kevin | $114,700 |
Source: Public Records
Tax History
| Year | Tax Paid | Tax Assessment Tax Assessment Total Assessment is a certain percentage of the fair market value that is determined by local assessors to be the total taxable value of land and additions on the property. | Land | Improvement |
|---|---|---|---|---|
| 2025 | $1,539 | $209,370 | $48,170 | $161,200 |
| 2024 | $1,518 | $209,370 | $48,170 | $161,200 |
| 2023 | $1,518 | $209,370 | $48,170 | $161,200 |
| 2022 | $1,086 | $122,930 | $25,080 | $97,850 |
| 2021 | $1,086 | $122,930 | $25,080 | $97,850 |
| 2020 | $1,077 | $122,930 | $25,080 | $97,850 |
| 2019 | $1,077 | $122,930 | $25,080 | $97,850 |
| 2018 | $1,032 | $114,160 | $22,180 | $91,980 |
| 2016 | $1,005 | $114,162 | $22,180 | $91,982 |
| 2015 | $1,008 | $114,162 | $22,180 | $91,982 |
| 2014 | $1,008 | $114,162 | $22,180 | $91,982 |
Source: Public Records
Map
Nearby Homes
- 5127 Sylvan Trail
- 5172 Jordan Valley Rd
- 5042 Jordan Valley Rd
- 3734 Carole Dr
- 3916 Rollingwood Ct
- 0000 Thayer Rd
- Lot 7 Thayer Rd
- 1874 Thayer Rd
- 5020 Cashatt Rd
- 3870 Hangar Run
- 4202 Beaumont Dr
- 2973 Bridge Point Dr
- 107 Royal Pines Dr
- 4700 Beau Ct
- Lot 12 Skeens Mill Rd
- Lot 10 Skeens Mill Rd
- 4484 Virginia Dr
- 2328 Jerico Rd
- 3554 Finch Farm Rd
- 4161 Kynwood Dr
- 4277 Hunters Run
- 4261 Hunters Run
- 4289 Hunters Run
- 4331 Oak Brook Ct
- 4266 Hunters Run
- 4249 Hunters Run
- 4250 Hunters Run
- 4349 Oak Brook Ct
- 4278 Hunters Run
- 4244 Hunters Run
- 4322 Oak Brook Ct
- 4353 Oak Brook Ct
- 4292 Hunters Run
- 4240 Hunters Run
- 2879 Hunt Ridge Ct
- 4334 Oak Brook Ct
- 4399 Hunters Run
- 4392 Hunters Run
- 2877 Hunt Ridge Ct
- 4344 Oak Brook Ct
Your Personal Tour Guide
Ask me questions while you tour the home.