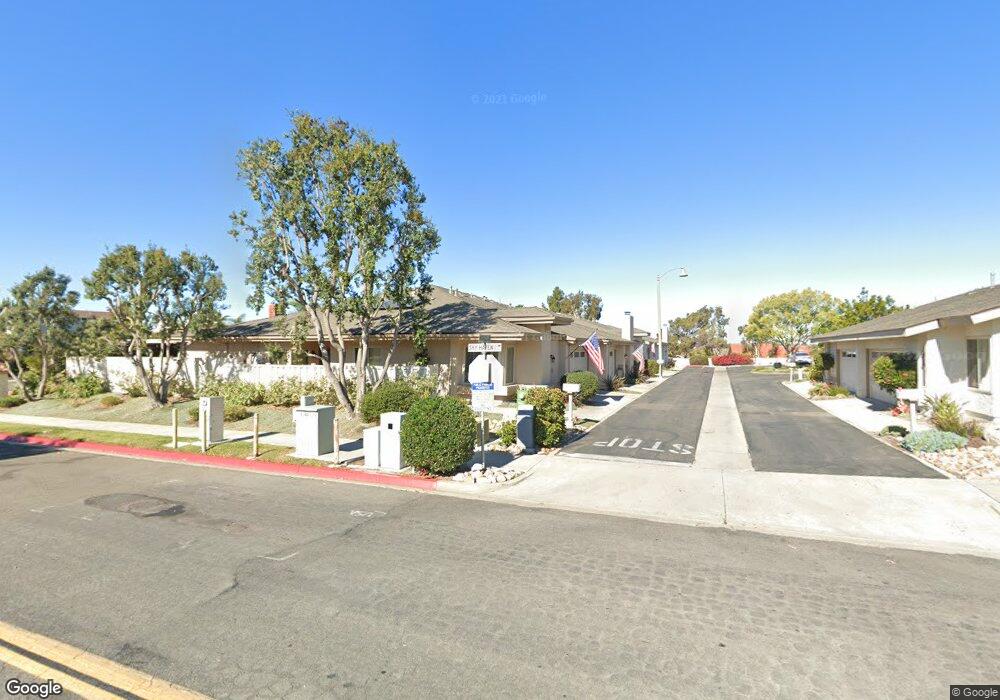
4265 Mirage Ln Unit 1 Oceanside, CA 92056
Lake NeighborhoodEstimated Value: $580,000 - $819,000
About This Home
This home is located at 4265 Mirage Ln Unit 1, Oceanside, CA 92056 and is currently estimated at $721,066, approximately $508 per square foot. 4265 Mirage Ln Unit 1 is a home located in San Diego County with nearby schools including Breeze Hill Elementary School, Madison Middle School, and Rancho Buena Vista High School.
Ownership History
We collect this data history from publicly available records. To have your information removed, we recommend requesting removal directly through your county’s website.
Purchase Details
Home Financials for this Owner
Home Financials are based on the most recent Mortgage that was taken out on this home.Purchase Details
Home Financials for this Owner
Home Financials are based on the most recent Mortgage that was taken out on this home.Purchase Details
Purchase Details
Home Values in the Area
Average Home Value in this Area
Purchase History
We collect this data history from publicly available records. To have your information removed, we recommend requesting removal directly through your county’s website.
| Date | Buyer | Sale Price | Title Company |
|---|---|---|---|
| -- | Lawyers Title | ||
| $275,000 | California Title Company | ||
| -- | -- | ||
| -- | -- |
Mortgage History
We collect this data history from publicly available records. To have your information removed, we recommend requesting removal directly through your county’s website.
| Date | Status | Borrower | Loan Amount |
|---|---|---|---|
| Open | $75,000 | ||
| Previous Owner | $50,000 |
Tax History
We collect this data history from publicly available records. To have your information removed, we recommend requesting removal directly through your county’s website.
| Year | Tax Paid | Tax Assessment Tax Assessment Total Assessment is a certain percentage of the fair market value that is determined by local assessors to be the total taxable value of land and additions on the property. | Land | Improvement |
|---|---|---|---|---|
| 2025 | $824 | $80,939 | $26,254 | $54,685 |
| 2024 | $824 | $79,353 | $25,740 | $53,613 |
| 2023 | $802 | $77,798 | $25,236 | $52,562 |
| 2022 | $798 | $76,274 | $24,742 | $51,532 |
| 2021 | $780 | $74,779 | $24,257 | $50,522 |
| 2020 | $776 | $74,013 | $24,009 | $50,004 |
| 2019 | $764 | $72,563 | $23,539 | $49,024 |
| 2018 | $726 | $71,141 | $23,078 | $48,063 |
| 2017 | $711 | $69,747 | $22,626 | $47,121 |
| 2016 | $691 | $68,381 | $22,183 | $46,198 |
| 2015 | $688 | $67,355 | $21,850 | $45,505 |
| 2014 | $671 | $66,036 | $21,422 | $44,614 |
Map
- 4225 Dawn Ln
- 68 Brookside Ln
- 3501 N Sundown Ln
- 283 Picnic View Ln
- 116 Havenview Ln
- 42 Havenview Ln
- 17 Blue Sky Ln
- 103 Havenview Ln
- 2130 Sunset Dr Unit 134
- 2130 Sunset Dr Unit 55
- 4161 Tiberon Dr
- 4137 Tiberon Dr
- 3446 Los Mochis Way
- 3466 Seabreeze Walk
- 3433 Los Mochis Way
- 3412 Los Mochis Way
- 3434 Seabreeze Walk
- 4558 Stratford Cir
- 3422 Seabreeze Walk Unit 20A
- 3433 Seabreeze Walk
- 4262 Mirage Ln
- 4266 Mirage Ln
- 3584 Twilight Ln Unit 1
- 3580 Twilight Ln
- 4270 Mirage Ln
- 3569 Sky Haven Ln
- 4287 Zenith Ln
- 3588 Twilight Ln
- 3567 Sky Haven Ln
- 4291 Zenith Ln Unit 3
- 3565 Sky Haven Ln
- 3592 Twilight Ln
- 4274 Mirage Ln
- 4293 Zenith Ln
- 4261 Mirage Ln
- 4269 Mirage Ln
- 4297 Zenith Ln
- 4273 Mirage Ln
- 3583 Twilight Ln
- 3587 Twilight Ln Unit 1
Ask me questions while you tour the home.