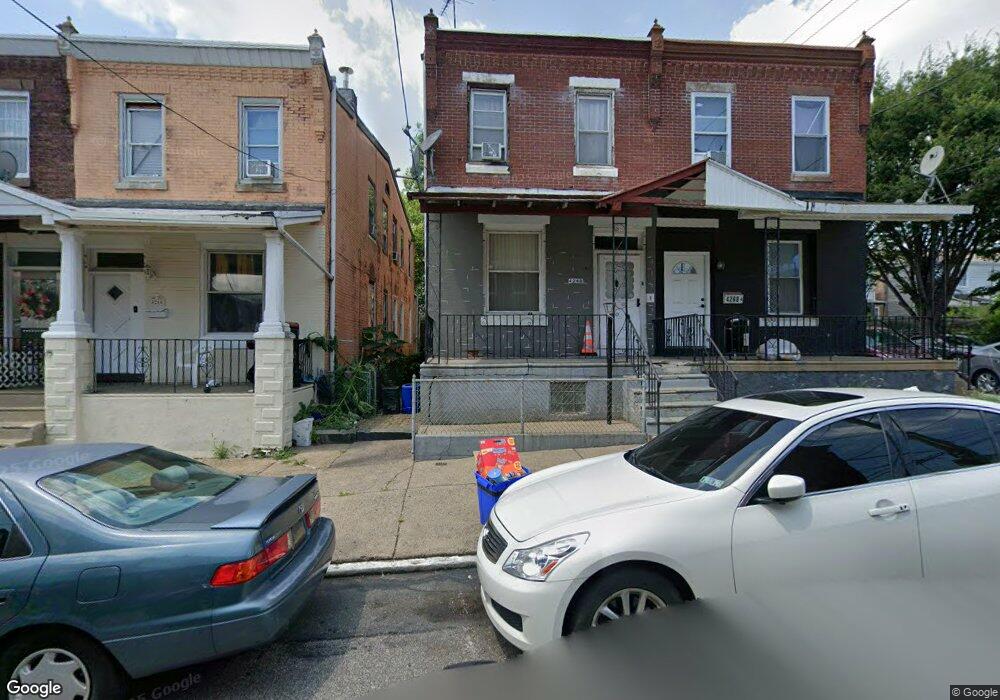
4266 Griscom St Philadelphia, PA 19124
Frankford NeighborhoodEstimated Value: $144,000 - $196,434
4
Beds
1
Bath
1,552
Sq Ft
$111/Sq Ft
Est. Value
About This Home
This home is located at 4266 Griscom St, Philadelphia, PA 19124 and is currently estimated at $171,859, approximately $110 per square foot. 4266 Griscom St is a home located in Philadelphia County with nearby schools including John Marshall School, Harding Warren G Middle School, and Frankford High School.
Create a Home Valuation Report for This Property
The Home Valuation Report is an in-depth analysis detailing your home's value as well as a comparison with similar homes in the area
Home Values in the Area
Average Home Value in this Area
Tax History Compared to Growth
Tax History
| Year | Tax Paid | Tax Assessment Tax Assessment Total Assessment is a certain percentage of the fair market value that is determined by local assessors to be the total taxable value of land and additions on the property. | Land | Improvement |
|---|---|---|---|---|
| 2026 | $1,261 | $154,100 | $30,800 | $123,300 |
| 2025 | $1,261 | $154,100 | $30,800 | $123,300 |
| 2024 | $1,261 | $154,100 | $30,800 | $123,300 |
| 2023 | $1,261 | $90,100 | $18,020 | $72,080 |
| 2022 | $1,100 | $90,100 | $18,020 | $72,080 |
| 2021 | $1,100 | $0 | $0 | $0 |
| 2020 | $1,100 | $0 | $0 | $0 |
| 2019 | $1,055 | $0 | $0 | $0 |
| 2018 | $1,023 | $0 | $0 | $0 |
| 2017 | $1,023 | $0 | $0 | $0 |
| 2016 | $1,023 | $0 | $0 | $0 |
| 2015 | $980 | $0 | $0 | $0 |
| 2014 | -- | $73,100 | $16,342 | $56,758 |
| 2012 | -- | $7,744 | $1,126 | $6,618 |
Source: Public Records
Map
Nearby Homes