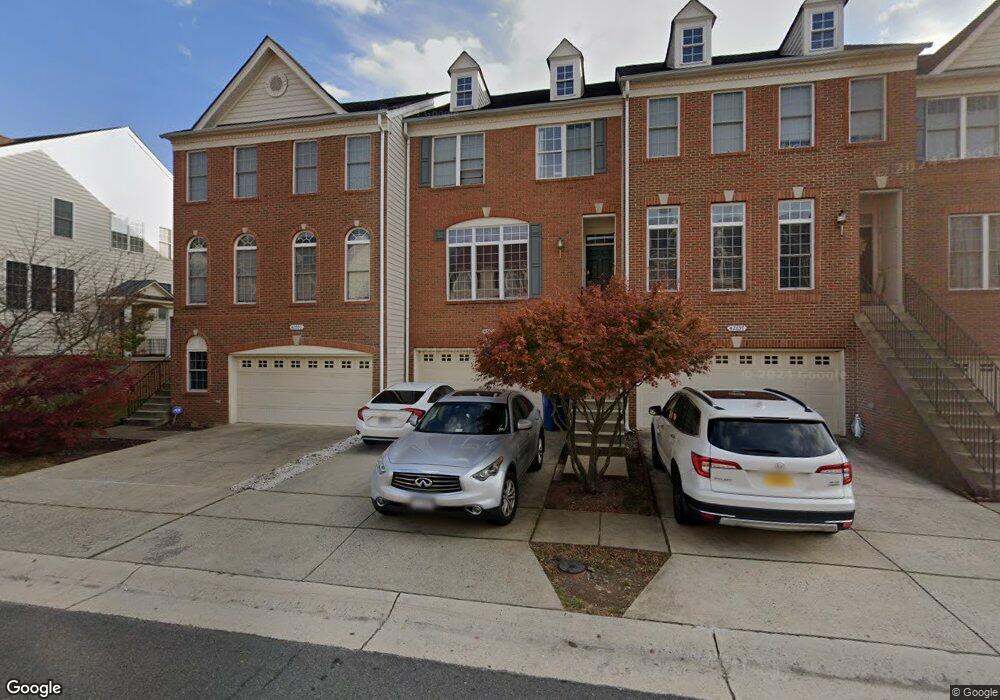
42699 Sandman Terrace Chantilly, VA 20152
Estimated Value: $664,000 - $728,000
3
Beds
4
Baths
2,283
Sq Ft
$301/Sq Ft
Est. Value
About This Home
This home is located at 42699 Sandman Terrace, Chantilly, VA 20152 and is currently estimated at $686,078, approximately $300 per square foot. 42699 Sandman Terrace is a home located in Loudoun County with nearby schools including Liberty Elementary School, J. Michael Lunsford Middle School, and Freedom High School.
Ownership History
Date
Name
Owned For
Owner Type
Purchase Details
Closed on
Nov 7, 2024
Sold by
Nguyen Huy
Bought by
Sage Bella Family Living Trust and Nguyen
Current Estimated Value
Purchase Details
Closed on
Sep 15, 2004
Sold by
South Riding Partners L P
Bought by
Nguyen Huy
Home Financials for this Owner
Home Financials are based on the most recent Mortgage that was taken out on this home.
Original Mortgage
$305,405
Interest Rate
6.02%
Mortgage Type
New Conventional
Create a Home Valuation Report for This Property
The Home Valuation Report is an in-depth analysis detailing your home's value as well as a comparison with similar homes in the area
Home Values in the Area
Average Home Value in this Area
Purchase History
| Date | Buyer | Sale Price | Title Company |
|---|---|---|---|
| Sage Bella Family Living Trust | -- | None Listed On Document | |
| Nguyen Huy | $381,813 | -- |
Source: Public Records
Mortgage History
| Date | Status | Borrower | Loan Amount |
|---|---|---|---|
| Previous Owner | Nguyen Huy | $305,405 |
Source: Public Records
Tax History Compared to Growth
Tax History
| Year | Tax Paid | Tax Assessment Tax Assessment Total Assessment is a certain percentage of the fair market value that is determined by local assessors to be the total taxable value of land and additions on the property. | Land | Improvement |
|---|---|---|---|---|
| 2025 | $5,162 | $641,280 | $215,000 | $426,280 |
| 2024 | $5,262 | $608,280 | $200,000 | $408,280 |
| 2023 | $4,866 | $556,070 | $200,000 | $356,070 |
| 2022 | $4,850 | $544,900 | $190,000 | $354,900 |
| 2021 | $4,735 | $483,140 | $155,000 | $328,140 |
| 2020 | $4,582 | $442,720 | $135,000 | $307,720 |
| 2019 | $4,396 | $420,710 | $135,000 | $285,710 |
| 2018 | $4,426 | $407,880 | $125,000 | $282,880 |
| 2017 | $4,411 | $392,070 | $125,000 | $267,070 |
| 2016 | $4,368 | $381,490 | $0 | $0 |
| 2015 | $4,408 | $263,330 | $0 | $263,330 |
| 2014 | $4,512 | $275,640 | $0 | $275,640 |
Source: Public Records
Map
Nearby Homes
- 42790 Sykes Terrace
- 42768 Kearney Terrace
- 25304 Shipley Terrace
- 25416 Carrington Dr
- 42799 Sykes Terrace
- 42791 Flannigan Terrace
- 25065 Riding Center Dr
- 42643 Homefront Terrace
- 25390 Shipley Terrace
- 25167 Femoyer Terrace
- 25466 Chambers Dr
- 25304 Whippoorwill Terrace
- 42828 Nations St
- 25202 Justice Dr
- 42835 Shaler St
- 43017 Beachall St
- 24958 Brookbark Terrace
- 0 Nethers Rd Unit VARP2001570
- 42289 Magistrate Ct
- 25442 Herring Creek Dr
- 42697 Sandman Terrace
- 42701 Sandman Terrace
- 42695 Sandman Terrace
- 42693 Sandman Terrace
- 42705 Sandman Terrace
- 25310 Nesting Square
- 25308 Nesting Square
- 25312 Nesting Square
- 42707 Sandman Terrace
- 25306 Nesting Square
- 42689 Sandman Terrace
- 25304 Nesting Square
- 25316 Nesting Square
- 42709 Sandman Terrace
- 42698 Sandman Terrace
- 42696 Sandman Terrace
- 42700 Sandman Terrace
- 25318 Nesting Square
- 42694 Sandman Terrace
- 42687 Sandman Terrace