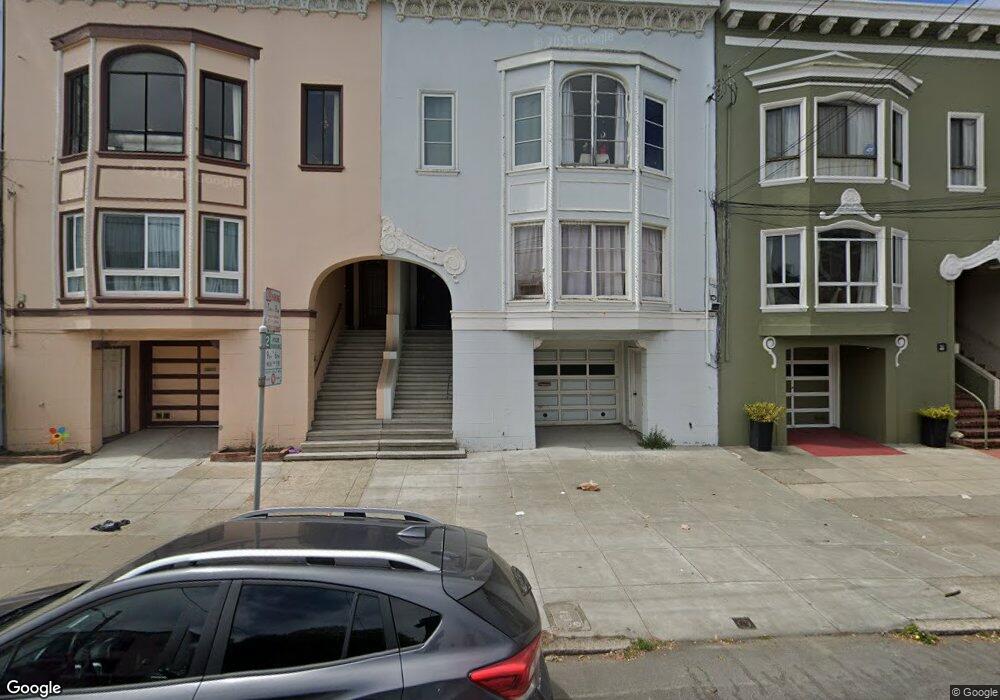
427 12th Ave Unit 429 San Francisco, CA 94118
Inner Richmond NeighborhoodEstimated Value: $1,959,000 - $3,250,367
--
Bed
2
Baths
3,160
Sq Ft
$747/Sq Ft
Est. Value
About This Home
This home is located at 427 12th Ave Unit 429, San Francisco, CA 94118 and is currently estimated at $2,360,092, approximately $746 per square foot. 427 12th Ave Unit 429 is a home located in San Francisco County with nearby schools including Frank McCoppin Elementary, Roosevelt Middle School, and Stratford School - San Francisco 14th Avenue.
Ownership History
Date
Name
Owned For
Owner Type
Purchase Details
Closed on
Mar 5, 2001
Sold by
Yang Raymond and Yung Wun
Bought by
Gavney Garry and Gavney Kathleen E
Current Estimated Value
Home Financials for this Owner
Home Financials are based on the most recent Mortgage that was taken out on this home.
Original Mortgage
$649,999
Outstanding Balance
$238,454
Interest Rate
7.12%
Mortgage Type
Commercial
Estimated Equity
$2,121,638
Purchase Details
Closed on
May 8, 2000
Sold by
Wu Ervina
Bought by
Yang Raymond
Home Financials for this Owner
Home Financials are based on the most recent Mortgage that was taken out on this home.
Original Mortgage
$600,000
Interest Rate
8.22%
Mortgage Type
Commercial
Purchase Details
Closed on
Dec 22, 1999
Sold by
Ling Yuan and Ling Betty
Bought by
Shuan Shao Ling
Home Financials for this Owner
Home Financials are based on the most recent Mortgage that was taken out on this home.
Original Mortgage
$430,000
Interest Rate
7.87%
Mortgage Type
Commercial
Create a Home Valuation Report for This Property
The Home Valuation Report is an in-depth analysis detailing your home's value as well as a comparison with similar homes in the area
Home Values in the Area
Average Home Value in this Area
Purchase History
| Date | Buyer | Sale Price | Title Company |
|---|---|---|---|
| Gavney Garry | $1,072,500 | Chicago Title Co | |
| Yang Raymond | -- | Chicago Title Co | |
| Yang Raymond | $756,000 | Chicago Title Co | |
| Shuan Shao Ling | $215,000 | Commonwealth Land Title Co |
Source: Public Records
Mortgage History
| Date | Status | Borrower | Loan Amount |
|---|---|---|---|
| Open | Gavney Garry | $649,999 | |
| Previous Owner | Yang Raymond | $600,000 | |
| Previous Owner | Shuan Shao Ling | $430,000 | |
| Closed | Gavney Garry | $150,000 |
Source: Public Records
Tax History Compared to Growth
Tax History
| Year | Tax Paid | Tax Assessment Tax Assessment Total Assessment is a certain percentage of the fair market value that is determined by local assessors to be the total taxable value of land and additions on the property. | Land | Improvement |
|---|---|---|---|---|
| 2025 | $19,267 | $1,616,050 | $979,426 | $636,624 |
| 2024 | $19,267 | $1,584,364 | $960,222 | $624,142 |
| 2023 | $19,250 | $1,553,300 | $941,396 | $611,904 |
| 2022 | $18,616 | $1,522,844 | $922,938 | $599,906 |
| 2021 | $18,285 | $1,492,986 | $904,842 | $588,144 |
| 2020 | $18,416 | $1,477,678 | $895,564 | $582,114 |
| 2019 | $17,784 | $1,448,704 | $878,004 | $570,700 |
| 2018 | $17,180 | $1,420,300 | $860,790 | $559,510 |
| 2017 | $16,679 | $1,392,452 | $843,912 | $548,540 |
| 2016 | $16,969 | $1,365,152 | $827,366 | $537,786 |
| 2015 | $16,415 | $1,344,648 | $814,940 | $529,708 |
| 2014 | $15,773 | $1,318,310 | $798,978 | $519,332 |
Source: Public Records
Map
Nearby Homes
- 459 11th Ave
- 428 15th Ave
- 550 9th Ave
- 4328 Geary Blvd
- 607 15th Ave
- 4829 California St
- 1533 Clement St
- 329 7th Ave
- 373 6th Ave
- 371 6th Ave
- 1545-1547 Balboa St
- 700 12th Ave Unit 6
- 154 Funston Ave
- 1608 Balboa St
- 369 18th Ave Unit 203
- 171 9th Ave Unit 173
- 118-120 15th Ave
- 118 15th Ave
- 185 7th Ave
- 1827 Clement St
- 423 12th Ave Unit 425
- 431 12th Ave
- 419 12th Ave Unit 421
- 435 12th Ave Unit 437
- 4801 Geary Blvd Unit 401
- 4801 Geary Blvd Unit 304
- 4801 Geary Blvd Unit 303
- 4801 Geary Blvd Unit 302
- 4801 Geary Blvd Unit 301
- 4801 Geary Blvd Unit 205
- 4801 Geary Blvd Unit 204
- 4801 Geary Blvd Unit 203
- 4801 Geary Blvd Unit 202
- 4801 Geary Blvd Unit 201
- 4801 Geary Blvd Unit 405
- 4801 Geary Blvd Unit 404
- 4801 Geary Blvd Unit 403
- 4801 Geary Blvd Unit 402
- 447 12th Ave Unit 449
- 430 Funston Ave