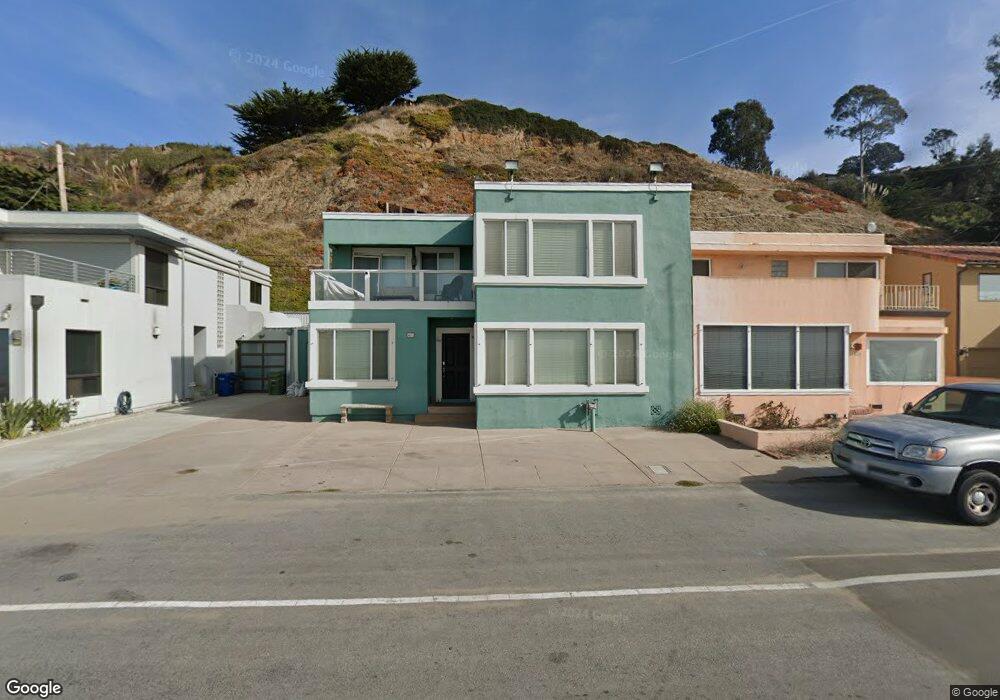
427 Beach Dr Aptos, CA 95003
Rio del Mar NeighborhoodEstimated Value: $2,348,854 - $3,319,000
4
Beds
3
Baths
2,067
Sq Ft
$1,305/Sq Ft
Est. Value
About This Home
This home is located at 427 Beach Dr, Aptos, CA 95003 and is currently estimated at $2,696,964, approximately $1,304 per square foot. 427 Beach Dr is a home located in Santa Cruz County with nearby schools including Rio Del Mar Elementary School, Aptos Junior High School, and Aptos High School.
Ownership History
Date
Name
Owned For
Owner Type
Purchase Details
Closed on
Jul 9, 2019
Sold by
Mcdevco Llc
Bought by
Mcdevco Amo Cantare Lp
Current Estimated Value
Purchase Details
Closed on
Jun 26, 2019
Sold by
Miramar
Bought by
Primo Partners and Secondo Partners
Purchase Details
Closed on
Jun 25, 2019
Sold by
Primo Partners
Bought by
Mcdevco Llc
Create a Home Valuation Report for This Property
The Home Valuation Report is an in-depth analysis detailing your home's value as well as a comparison with similar homes in the area
Home Values in the Area
Average Home Value in this Area
Purchase History
| Date | Buyer | Sale Price | Title Company |
|---|---|---|---|
| Mcdevco Amo Cantare Lp | -- | First American Title Ins Co | |
| Primo Partners | -- | First American Title Ins Co | |
| Mcdevco Llc | $2,100,000 | First American Title Company |
Source: Public Records
Tax History
| Year | Tax Paid | Tax Assessment Tax Assessment Total Assessment is a certain percentage of the fair market value that is determined by local assessors to be the total taxable value of land and additions on the property. | Land | Improvement |
|---|---|---|---|---|
| 2025 | $22,259 | $1,974,031 | $1,607,660 | $366,371 |
| 2023 | $21,869 | $1,897,377 | $1,545,232 | $352,145 |
| 2022 | $21,447 | $1,860,174 | $1,514,934 | $345,240 |
| 2021 | $20,963 | $1,823,700 | $1,485,229 | $338,471 |
| 2020 | $20,631 | $1,805,000 | $1,470,000 | $335,000 |
| 2019 | $4,530 | $321,565 | $211,649 | $109,916 |
| 2018 | $4,400 | $315,260 | $207,499 | $107,761 |
| 2017 | $4,350 | $309,078 | $203,430 | $105,648 |
| 2016 | $4,128 | $303,017 | $199,441 | $103,576 |
Source: Public Records
Map
Nearby Homes
- 433 Seaview Dr
- 532 Bayview Dr
- 320 Cliff Dr
- 545 Beach Dr
- 457 Townsend Dr
- 325 Beach Dr
- 227 Kingsbury Dr
- 619 Beach Dr
- 621 Beach Dr
- 322 Arthur Ave
- 273 Rio Del Mar Blvd
- 240 Rio Del Mar Blvd Unit O
- 105 Dunsmuir Ct Unit 1
- 229 Rio Del Mar Blvd
- 220 Beach Dr
- 140 Marina Ave Unit A
- 130 Hainline Rd
- 424 Palmer Ave
- 261 Aptos Beach Dr
- 204 Aptos Beach Dr
Your Personal Tour Guide
Ask me questions while you tour the home.