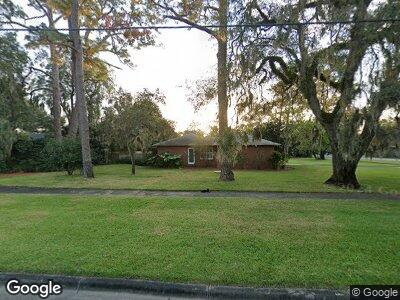
427 Union St Brunswick, GA 31520
South End NeighborhoodEstimated Value: $231,990 - $337,000
3
Beds
2
Baths
1,758
Sq Ft
$163/Sq Ft
Est. Value
About This Home
This home is located at 427 Union St, Brunswick, GA 31520 and is currently estimated at $285,998, approximately $162 per square foot. 427 Union St is a home located in Glynn County with nearby schools including Oglethorpe Point Elementary School, Glynn Middle School, and Glynn Academy.
Ownership History
Date
Name
Owned For
Owner Type
Purchase Details
Closed on
Aug 28, 2013
Sold by
Whittle Joseph A
Bought by
Smith Charles E
Current Estimated Value
Home Financials for this Owner
Home Financials are based on the most recent Mortgage that was taken out on this home.
Original Mortgage
$105,000
Outstanding Balance
$80,833
Interest Rate
4.37%
Mortgage Type
New Conventional
Purchase Details
Closed on
Oct 8, 2010
Sold by
Whittle Joseph A
Bought by
Whittle Joseph A
Purchase Details
Closed on
May 14, 2009
Sold by
Whittle Joseph A and Whittle Eleanor I
Bought by
Whittle Joseph A and Will Of Eleanor I Whittle
Create a Home Valuation Report for This Property
The Home Valuation Report is an in-depth analysis detailing your home's value as well as a comparison with similar homes in the area
Home Values in the Area
Average Home Value in this Area
Purchase History
| Date | Buyer | Sale Price | Title Company |
|---|---|---|---|
| Smith Charles E | $110,000 | -- | |
| Whittle Joseph A | -- | -- | |
| Whittle Joseph A | -- | -- |
Source: Public Records
Mortgage History
| Date | Status | Borrower | Loan Amount |
|---|---|---|---|
| Closed | Smith Charles E | $105,000 |
Source: Public Records
Tax History Compared to Growth
Tax History
| Year | Tax Paid | Tax Assessment Tax Assessment Total Assessment is a certain percentage of the fair market value that is determined by local assessors to be the total taxable value of land and additions on the property. | Land | Improvement |
|---|---|---|---|---|
| 2024 | $1,767 | $84,080 | $11,560 | $72,520 |
| 2023 | $1,605 | $84,080 | $11,560 | $72,520 |
| 2022 | $2,198 | $81,880 | $11,560 | $70,320 |
| 2021 | $1,941 | $63,400 | $11,560 | $51,840 |
| 2020 | $1,953 | $63,400 | $11,560 | $51,840 |
| 2019 | $795 | $63,400 | $11,560 | $51,840 |
| 2018 | $945 | $46,160 | $11,560 | $34,600 |
| 2017 | $1,625 | $39,680 | $11,560 | $28,120 |
| 2016 | $1,505 | $39,680 | $11,560 | $28,120 |
| 2015 | $1,683 | $43,960 | $9,360 | $34,600 |
| 2014 | $1,683 | $43,960 | $9,360 | $34,600 |
Source: Public Records
Map
Nearby Homes