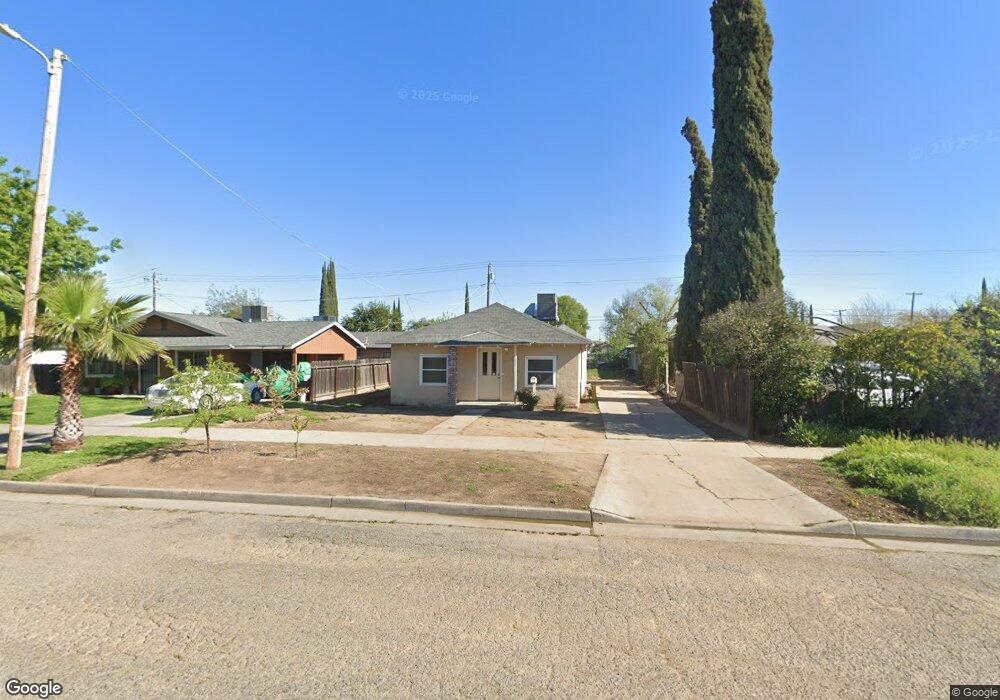
427 W 5th St Merced, CA 95341
South Merced NeighborhoodEstimated Value: $225,000 - $279,000
3
Beds
2
Baths
972
Sq Ft
$259/Sq Ft
Est. Value
About This Home
This home is located at 427 W 5th St, Merced, CA 95341 and is currently estimated at $251,566, approximately $258 per square foot. 427 W 5th St is a home located in Merced County with nearby schools including Alicia Reyes Elementary School, Tenaya Middle School, and Merced High School.
Ownership History
Date
Name
Owned For
Owner Type
Purchase Details
Closed on
Jan 22, 2001
Sold by
Davidson Rhonda L
Bought by
Martinez Andrew David
Current Estimated Value
Home Financials for this Owner
Home Financials are based on the most recent Mortgage that was taken out on this home.
Original Mortgage
$7,500
Outstanding Balance
$2,685
Interest Rate
7.13%
Mortgage Type
Seller Take Back
Estimated Equity
$248,881
Create a Home Valuation Report for This Property
The Home Valuation Report is an in-depth analysis detailing your home's value as well as a comparison with similar homes in the area
Home Values in the Area
Average Home Value in this Area
Purchase History
| Date | Buyer | Sale Price | Title Company |
|---|---|---|---|
| Martinez Andrew David | $72,500 | Chicago Title Co |
Source: Public Records
Mortgage History
| Date | Status | Borrower | Loan Amount |
|---|---|---|---|
| Open | Martinez Andrew David | $7,500 |
Source: Public Records
Tax History
| Year | Tax Paid | Tax Assessment Tax Assessment Total Assessment is a certain percentage of the fair market value that is determined by local assessors to be the total taxable value of land and additions on the property. | Land | Improvement |
|---|---|---|---|---|
| 2025 | $1,173 | $109,471 | $45,192 | $64,279 |
| 2024 | $1,173 | $107,330 | $44,306 | $63,024 |
| 2023 | $1,157 | $105,232 | $43,438 | $61,794 |
| 2022 | $1,141 | $103,175 | $42,587 | $60,588 |
| 2021 | $1,139 | $101,157 | $41,752 | $59,405 |
| 2020 | $1,146 | $100,123 | $41,324 | $58,799 |
| 2019 | $1,129 | $98,165 | $40,514 | $57,651 |
| 2018 | $1,031 | $96,271 | $39,720 | $56,551 |
| 2017 | $1,069 | $94,365 | $38,942 | $55,423 |
| 2016 | $1,053 | $92,521 | $38,179 | $54,342 |
| 2015 | $1,036 | $91,136 | $37,606 | $53,530 |
| 2014 | $958 | $84,275 | $30,000 | $54,275 |
Source: Public Records
Map
Nearby Homes
Your Personal Tour Guide
Ask me questions while you tour the home.